

The key to creating content that’s relevant, engaging, and sparks conversions? Start by knowing your audience.
That’s in the ABC of every marketer, and today I’m happy to introduce another important analytics layer that helps with just that: audience insights.
Planable Analytics is available for Facebook, Instagram, LinkedIn, and TikTok. The information presented is slightly different for each platform, as it’s highly dependent on each available API. So here’s everything you can find in Planable Analytics:
1. Audience insights
With audience insights, you can find relevant information about your followers so you create content that lands just right.
Audience insights are available for Instagram, LinkedIn, and TikTok. For all these, you can intuitively see the location map of your followers, colored by density.
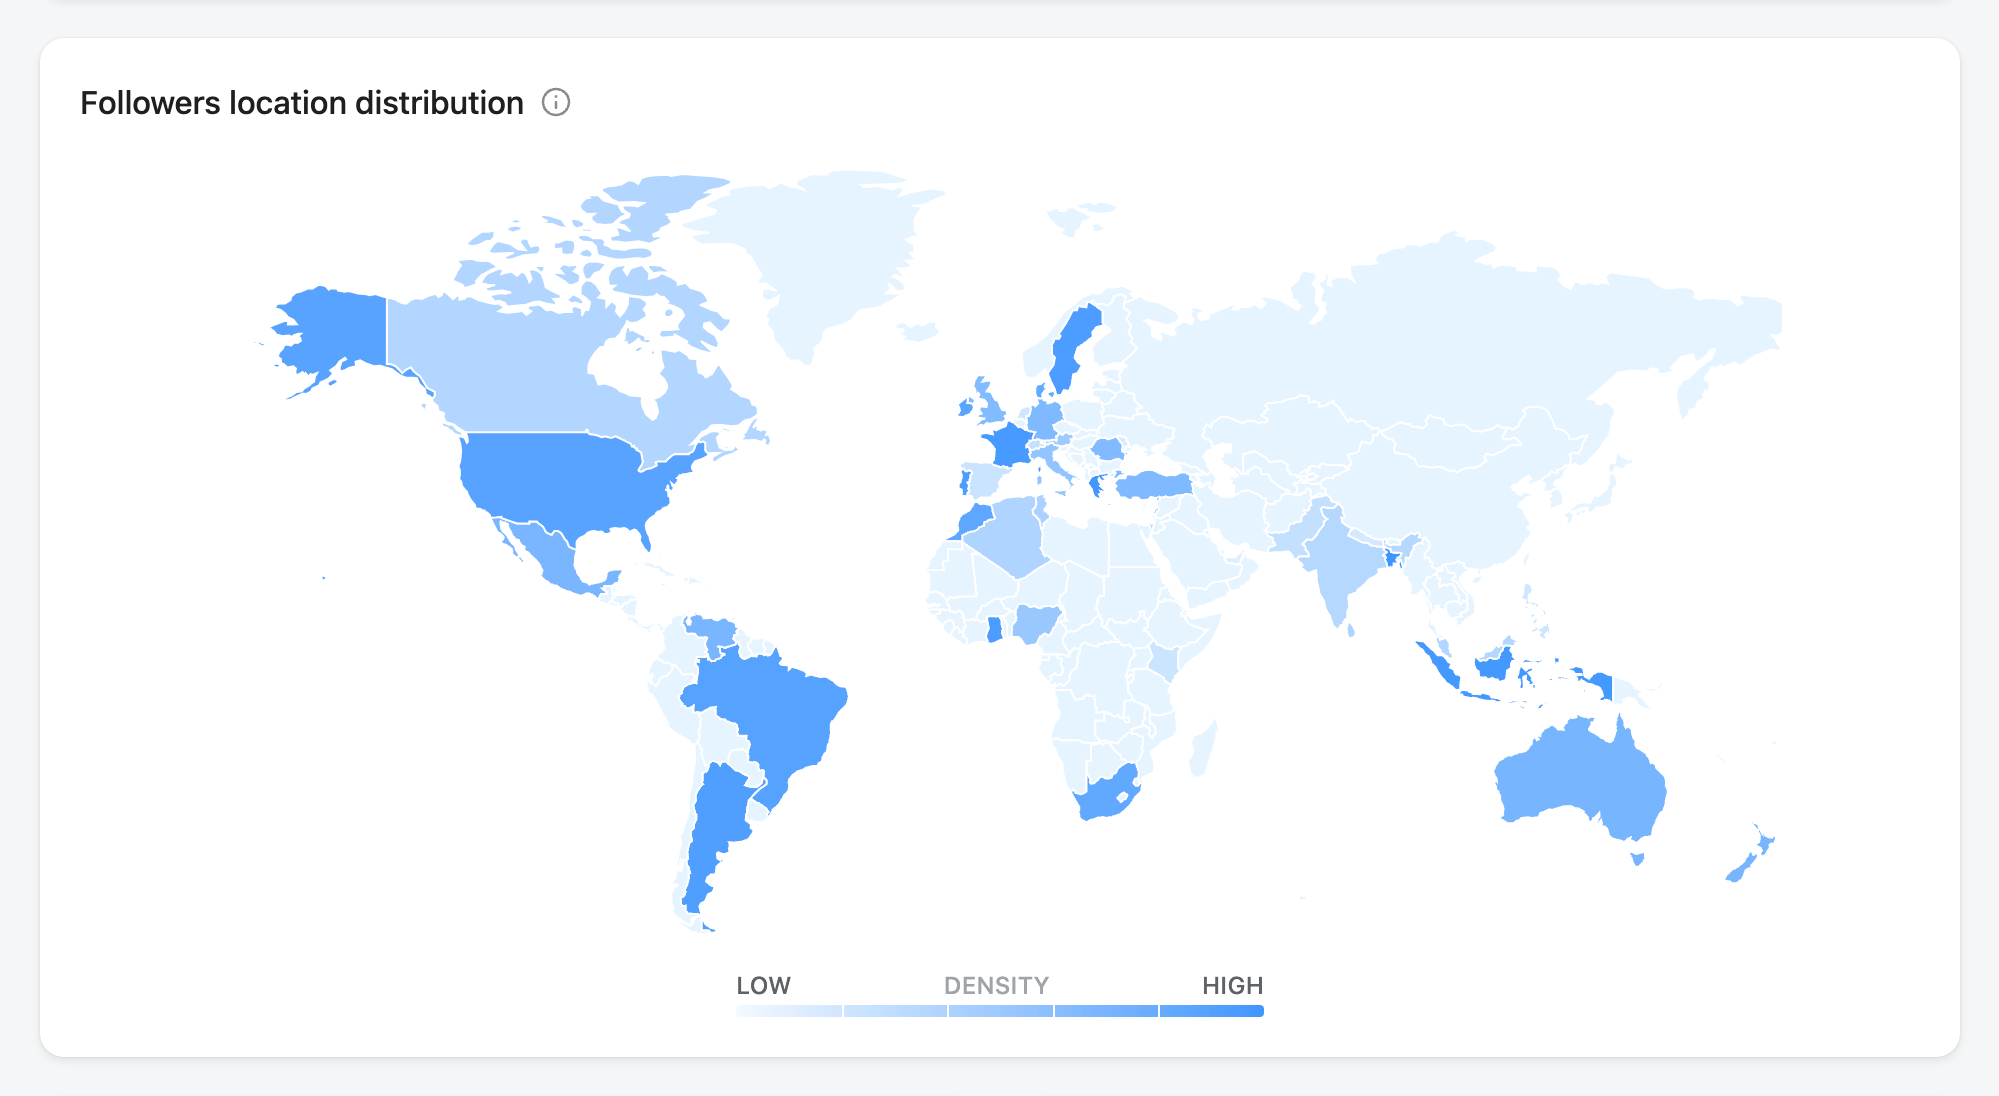
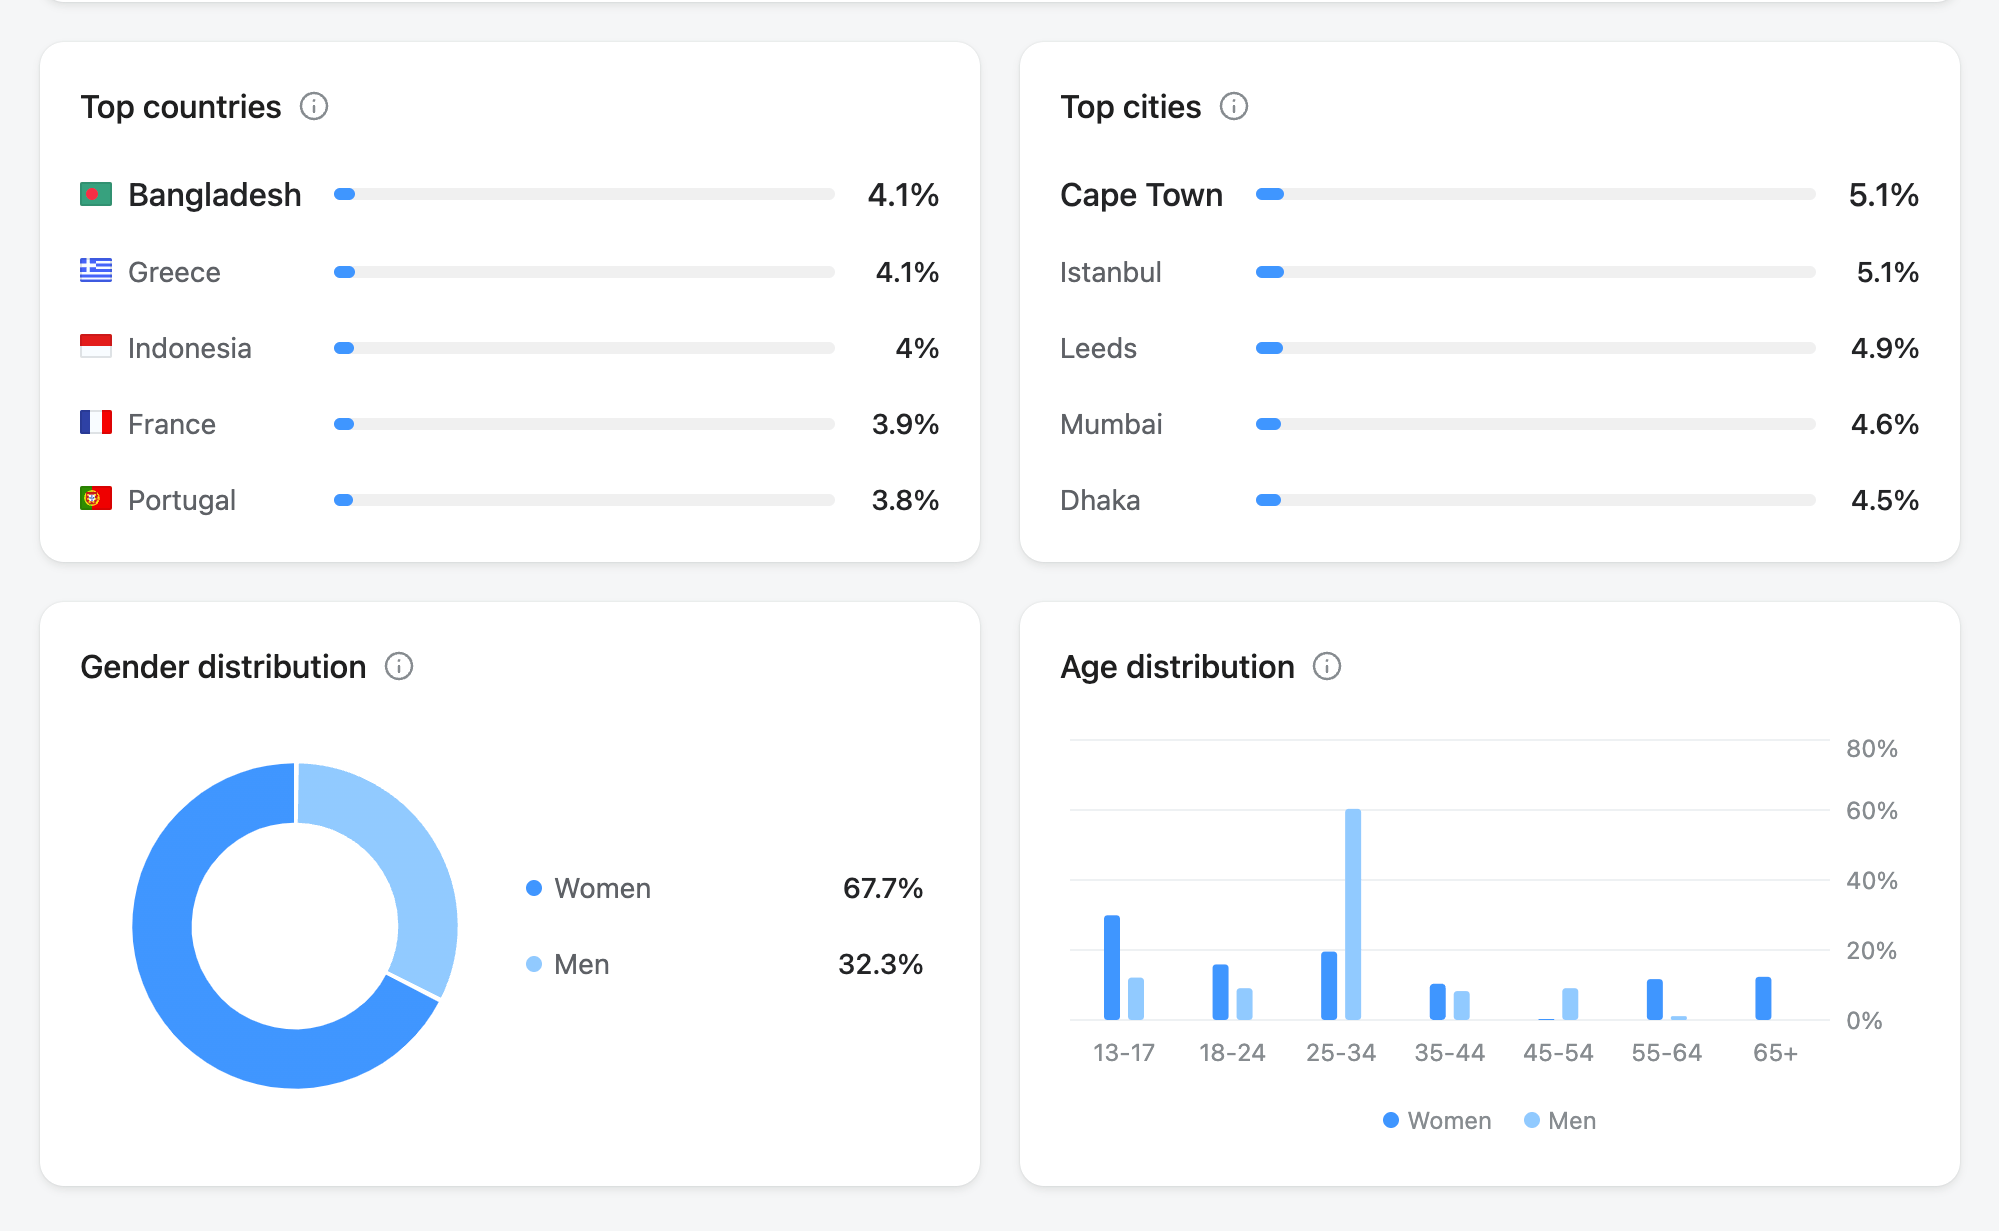
Easily grasp details about your followers, such as top countries, top cities, age and gender distribution.
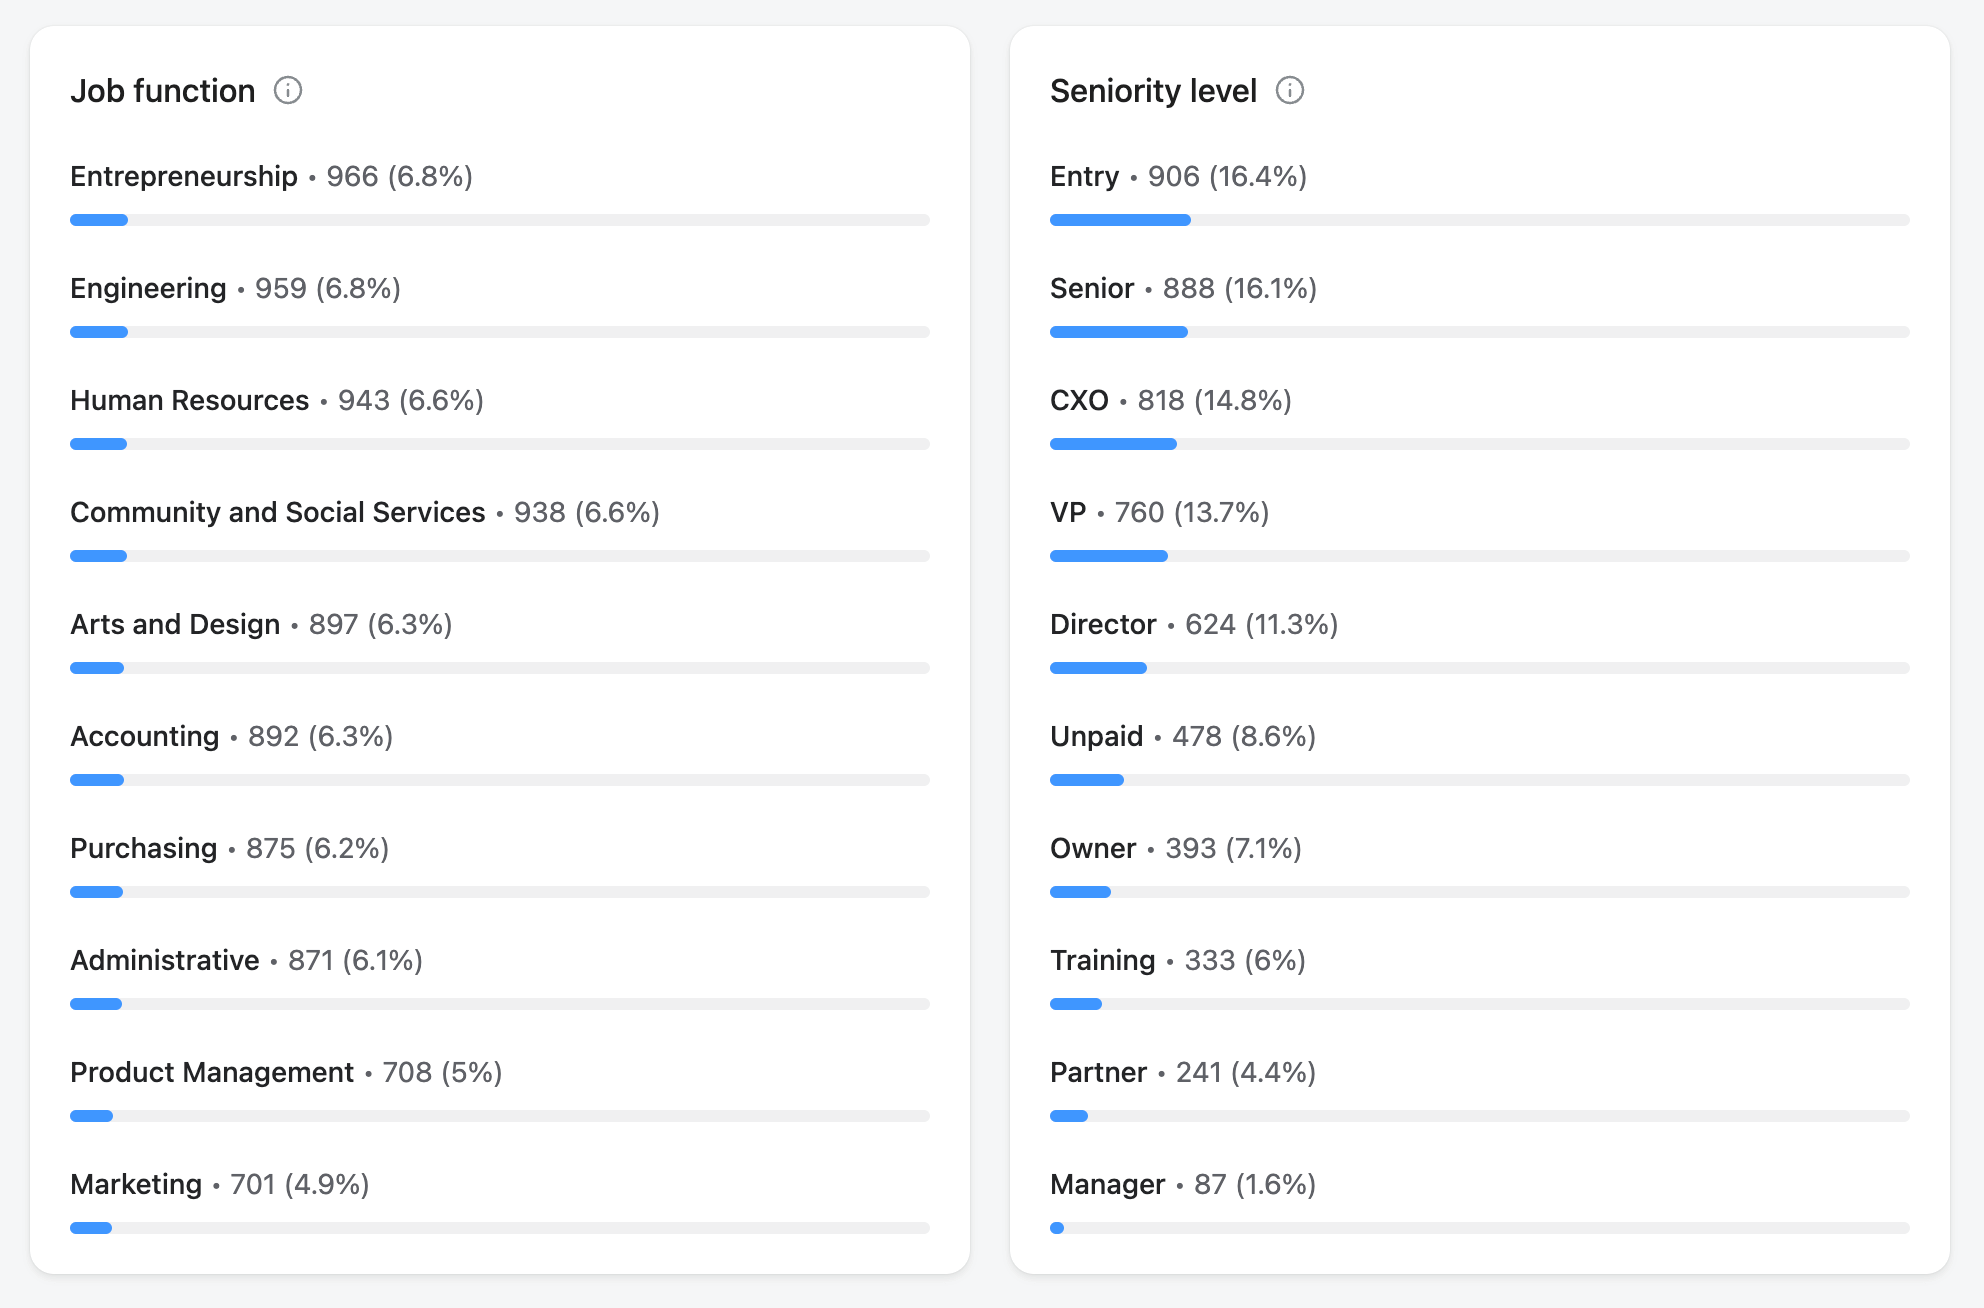
On LinkedIn, you can also find out details about your followers’ job functions and seniority levels.
2. Page metrics
Show the value of your work through the growth of each social channel. Easily see how pages perform over time, in terms of number of followers, reach, impressions, engagement, and profile visits.
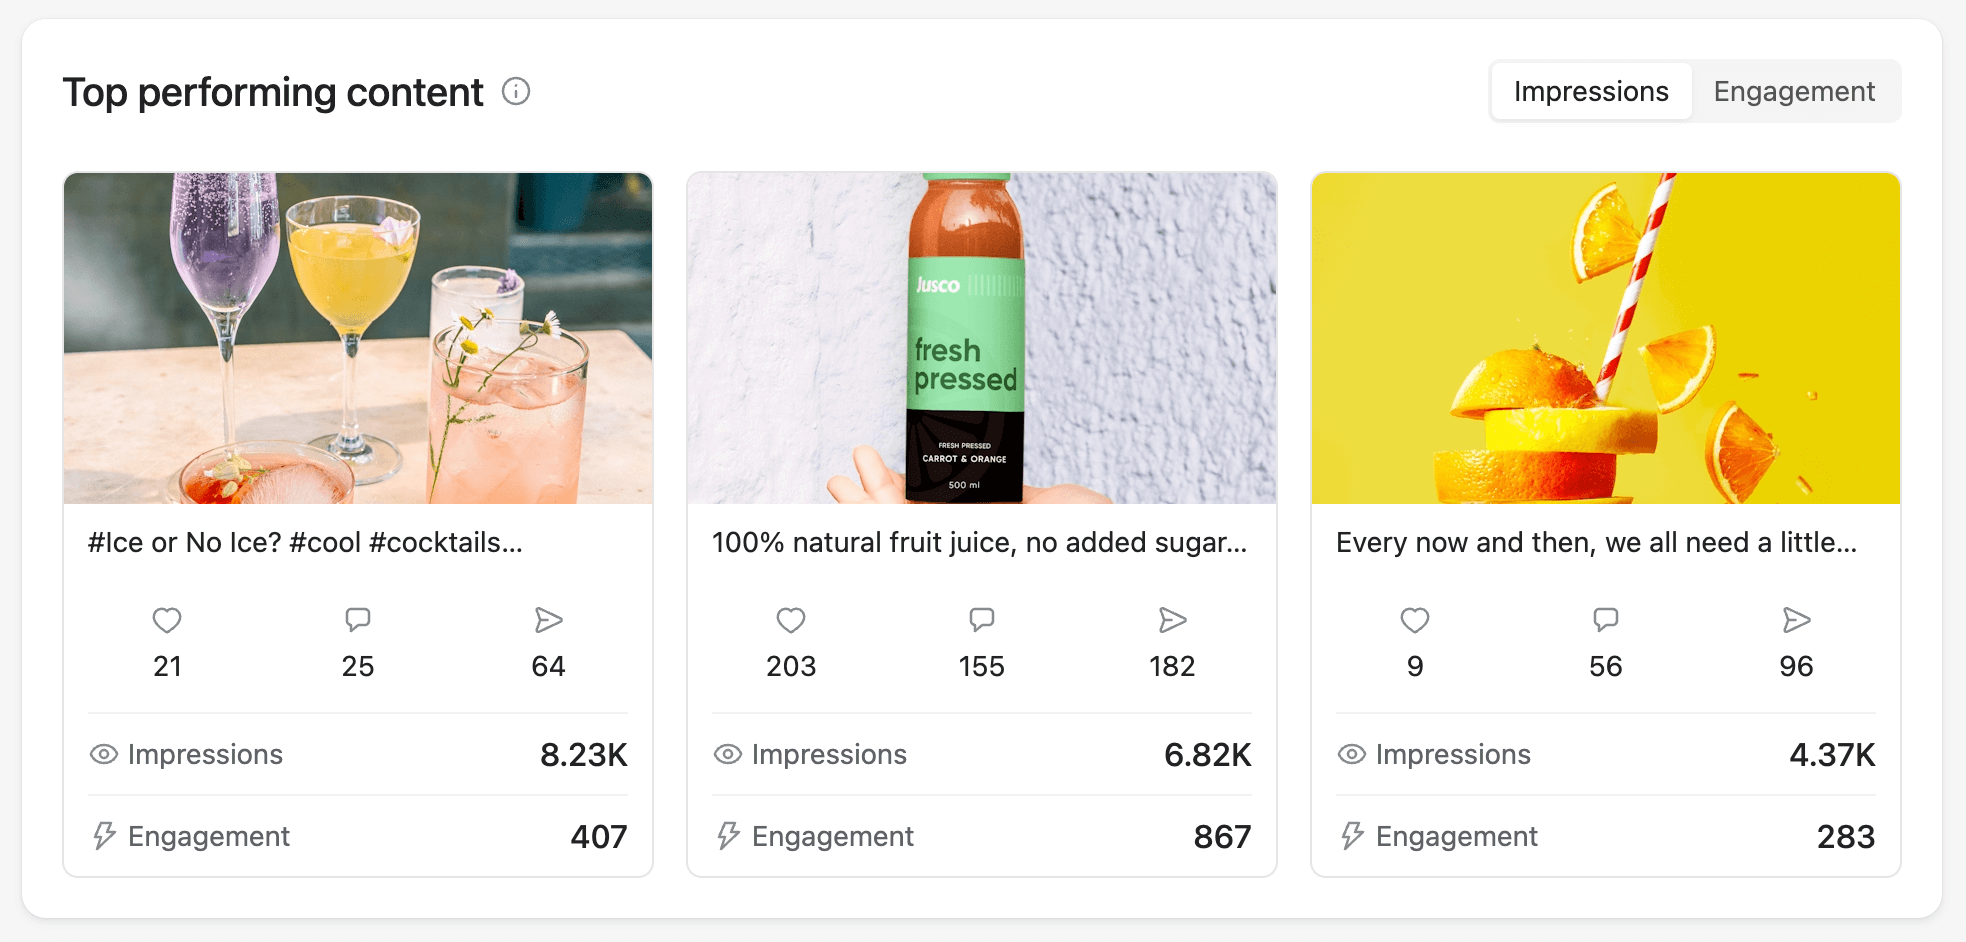
3. Top-performing content
Spot the winning content instantly and double down on what works. Planable Analytics shows you the top 3 best performing posts in terms of impressions or engagement.
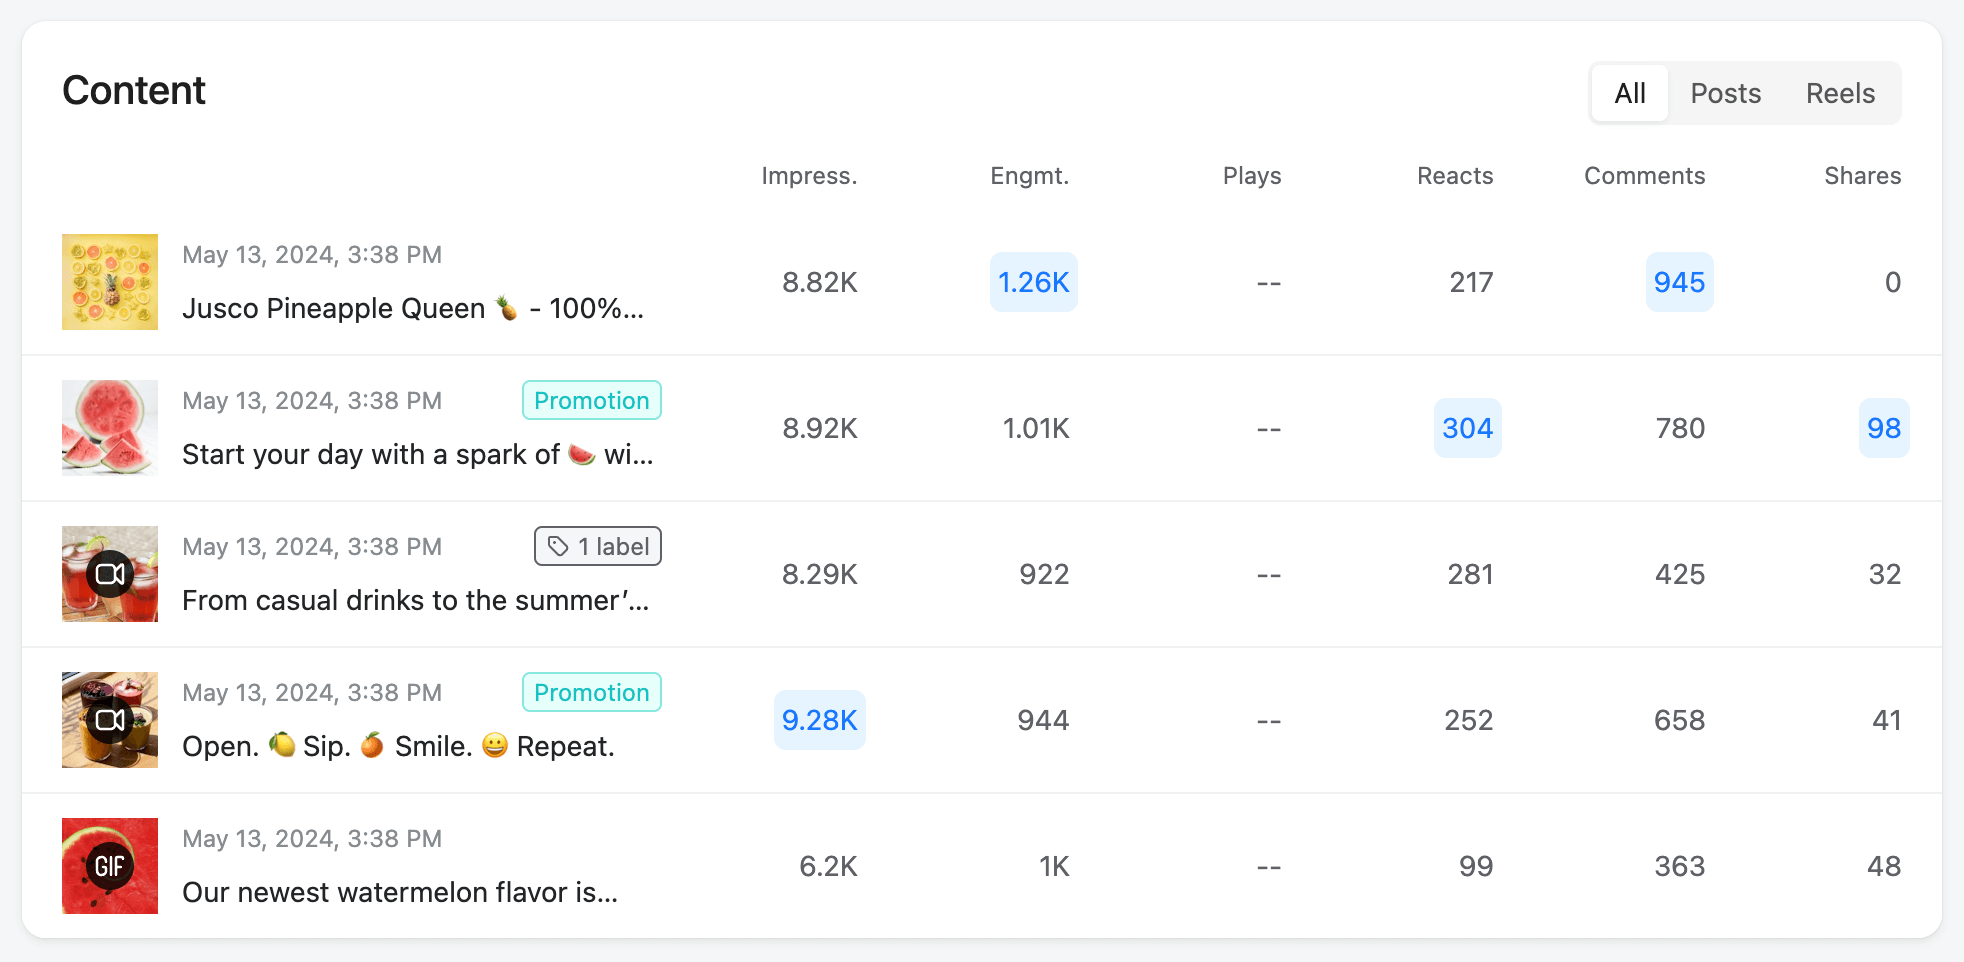
You can also view all your published posts and see which ones did best, based on each metric.
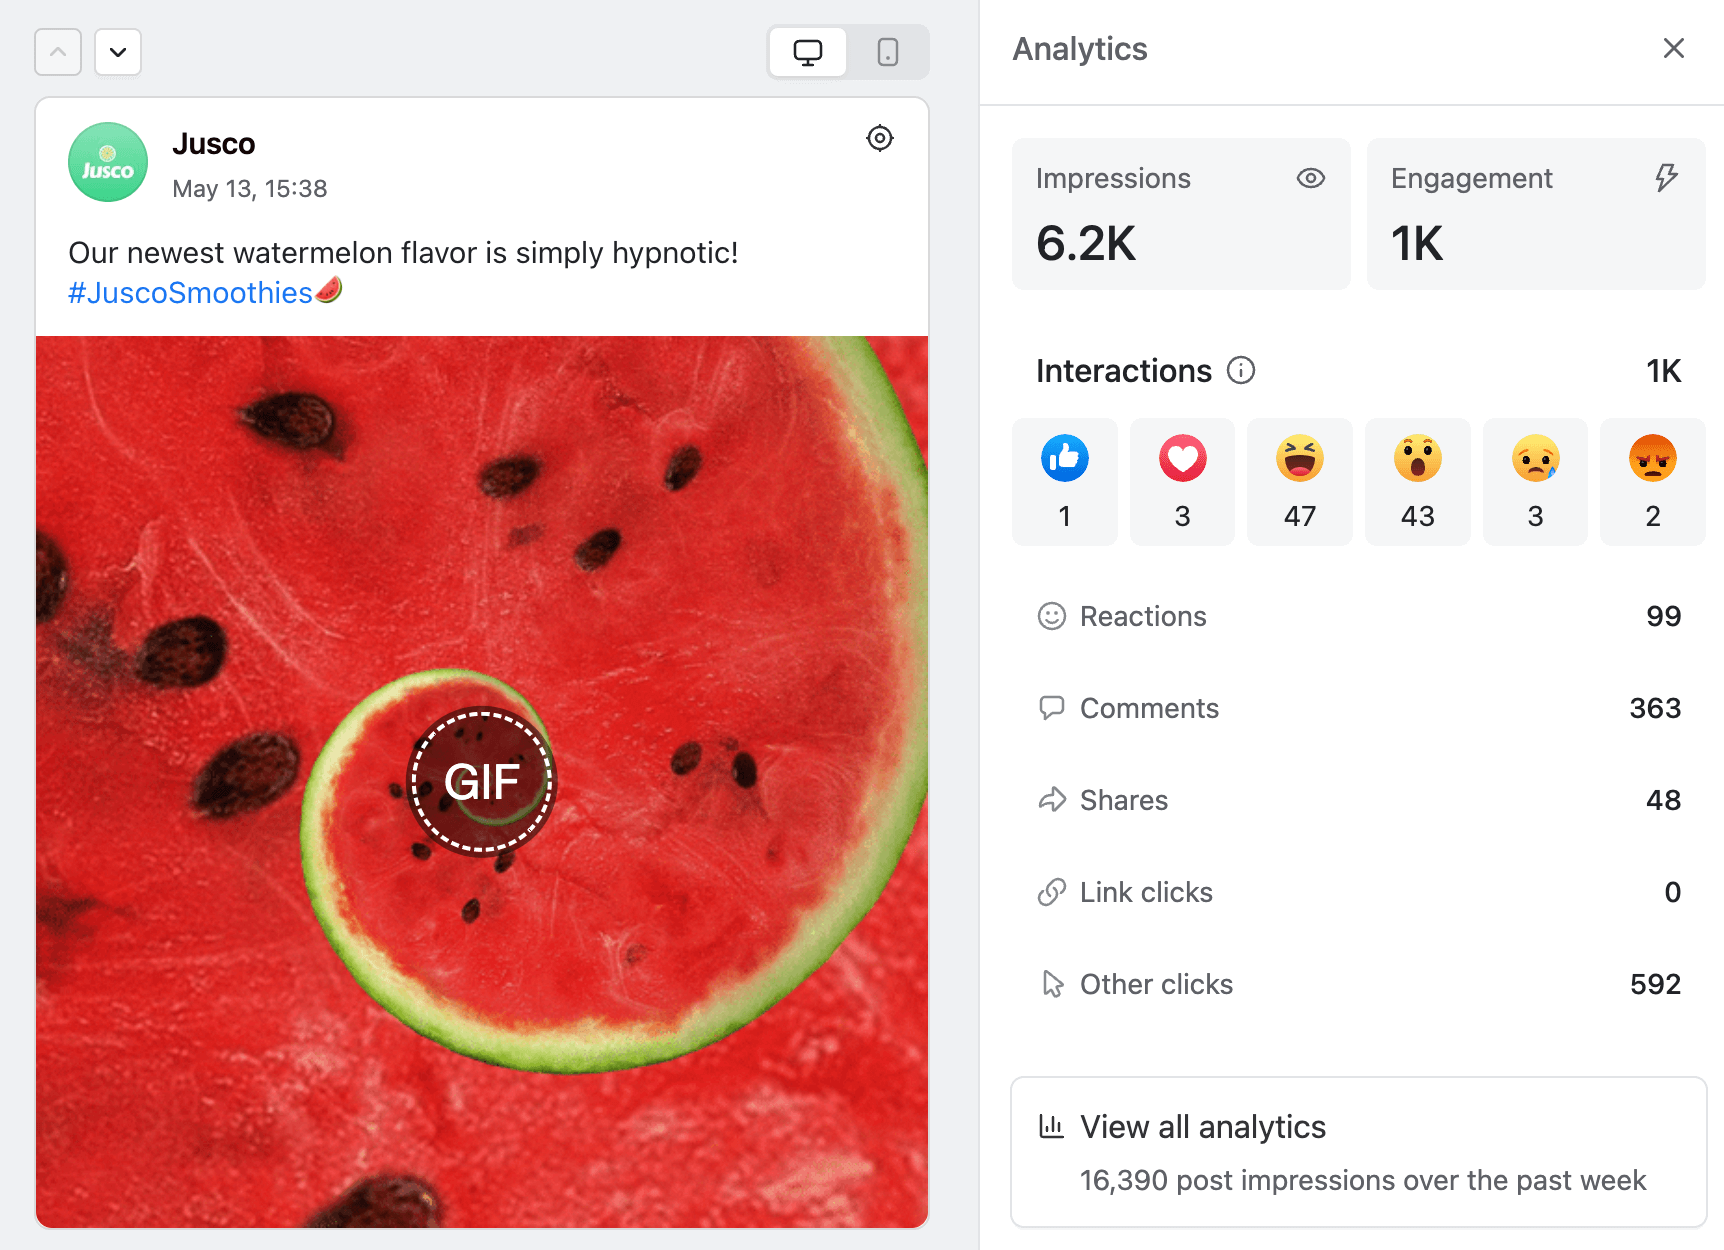
4. In-depth insights for every piece of content
For each post, go even more into detail and see how your audience engages and reacts. View advanced info such as detailed reactions, link clicks, or video plays.
5. Create delightful reports
When it’s time to present your work to clients, show your results in style. Quickly generate social media reports and share them via downloadable PDFs or easily accessible direct links.
Planable Analytics is an add-on available for all paid plans, and it comes with a 7-day free trial. Before deciding on Analytics, you can try all of Planable’s social media collaboration and scheduling features for free, for 50 posts, no strings attached.

Miruna Dragomir, CMO @Planable, ex Social Media Comms Manager @Oracle & ex Marketing Coordinator @Uber. 9 years of experience in social media and marketing. Built Planable’s brand and reputation and helped grow it from 50 customers to over 6.5K. Social media fanatic, tech geek & a sucker for learning.
