Social media collaboration tools help marketing teams and agencies to plan, draft, review, approve, and schedule posts in one place, so content moves easily from idea → publish without messy email threads, scattered comments, or unclear “latest versions.” For agencies...
Redesign For multi-location brands
all your locations, one content flow
For multi-brand companies
content collaboration at scale
For agencies
impress your clients and take on more
“The team loved it from the start. Planable helps us overview the entire marketing efforts.“
A good social media report is everything. It helps you track your brand’s growth, shape the content strategy, and communicate your success to the team. With the help of social media analytics tools, you can lay out all your efforts in one concise document, enabling informed decision-making and a strategic approach.
However, understanding the state of your social media involves so many nuances, from ROI analysis to detailed breakdowns of every post. What do you include in a report to your clients or higher-ups to inform but not overwhelm them?
This article is your ultimate guide to building a perfect social media report that helps your team improve your strategy and see the big picture. Read on!
What is a social media report?
A social media report is a document that compiles social media data to assess the performance of individual social media posts, marketing campaigns, or a general social marketing strategy. It includes essential metrics on audience engagement, content effectiveness, and the overall impact of social media activities.
These reports enable data-driven strategizing and help teams communicate their efforts to stakeholders.
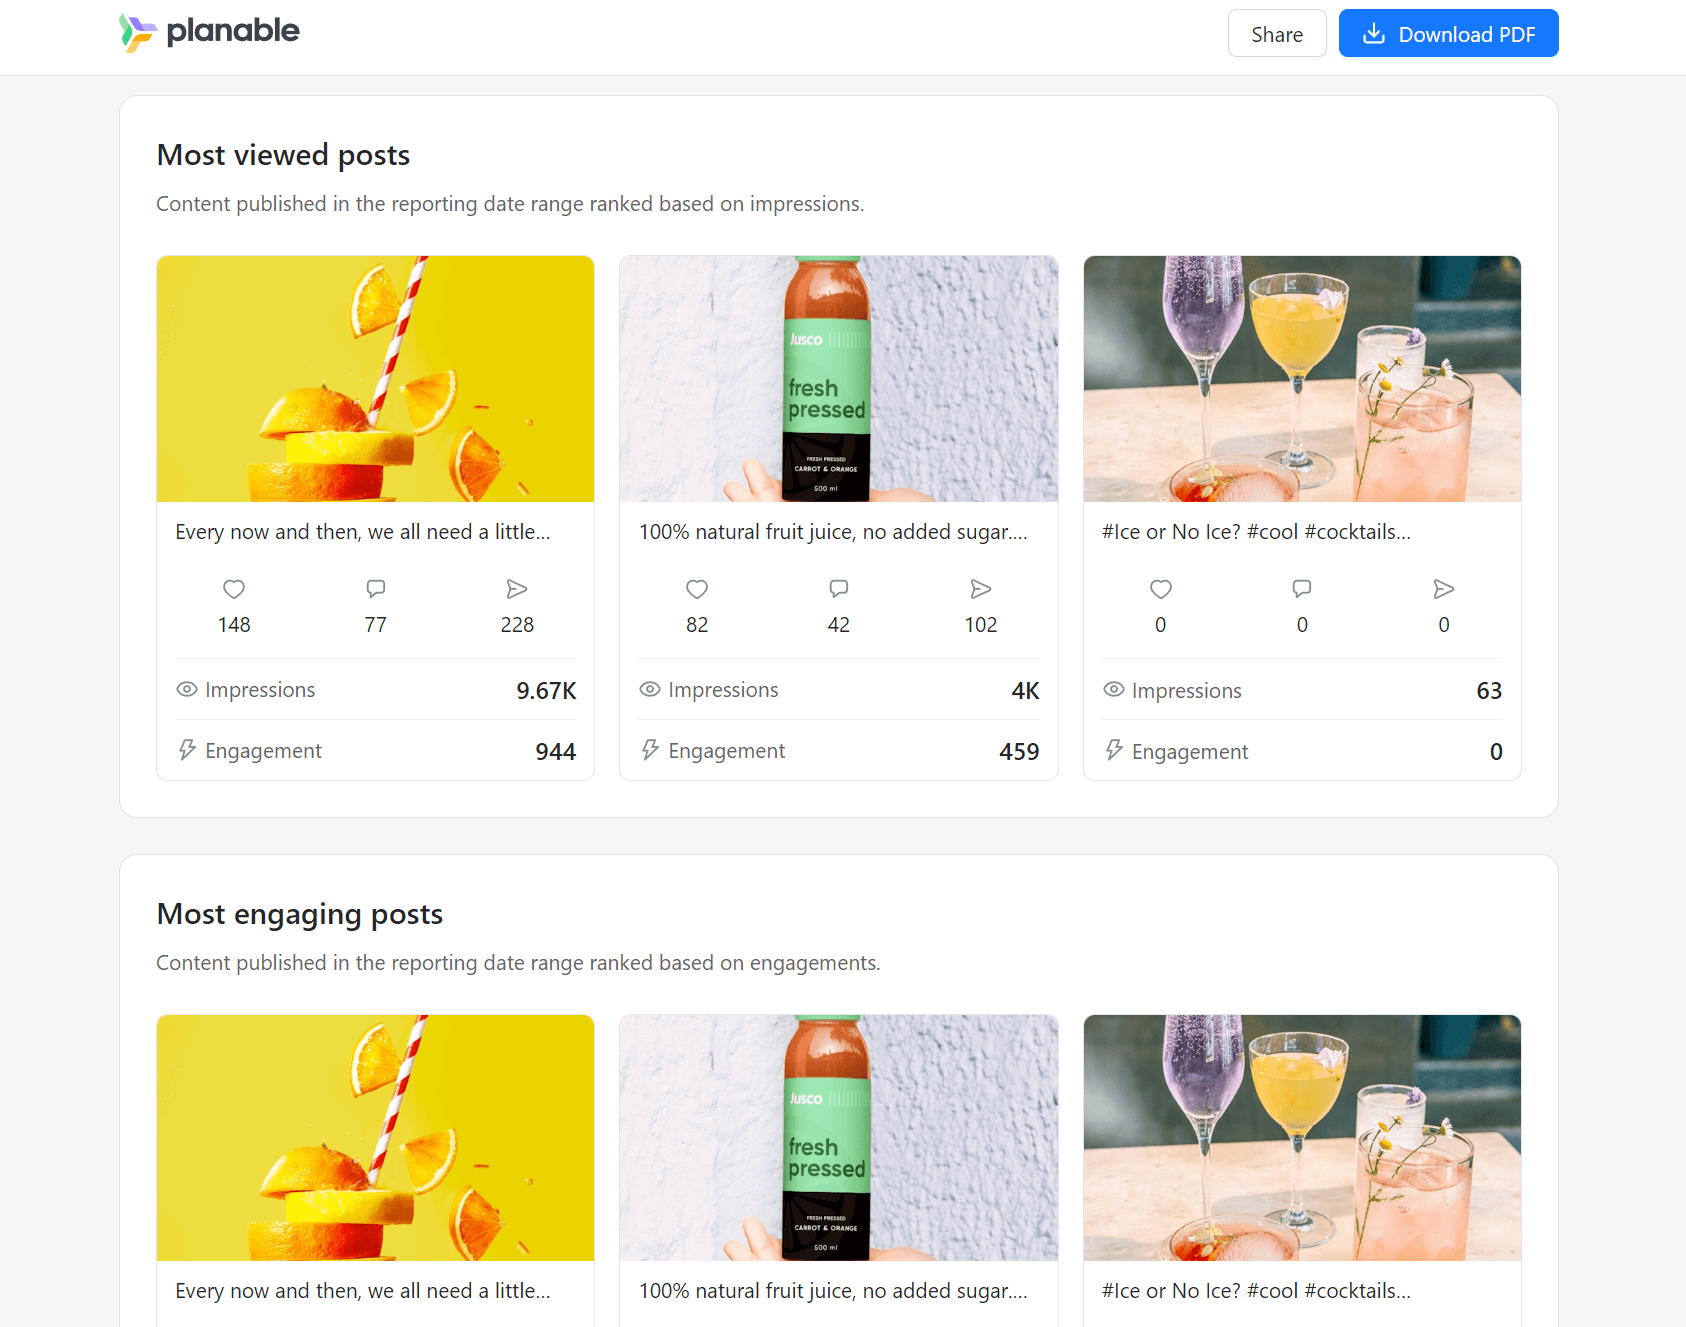
Most viewed and most engaging post reports in Planable
What should you include in a social media report?
Include data that will give you and your client a clear picture of your social media efforts. Your goals define which social media metrics you want to put in the spotlight, but generally, here’s what you should include:
Engagement metrics: likes, comments, shares, and overall interaction rates
Reach: the total number of unique viewers who have seen your content
Impressions: how many times your posts have been seen to assess content visibility
Top-performing content: posts with the highest engagement rate or view count, depending on your goal
ROI: the return on investment of your social media marketing efforts to evaluate financial impact
Follower growth shows the rate at which your social media following increases.
*It shows if your content converts and retains users, moving them down the marketing funnel.
Ease the gathering of this data and more with Planable’s Analytics. This neat social media analytics tool provides intuitive insights into core social media metrics across platforms like Facebook, Instagram, TikTok, and LinkedIn.
How to make a social report step-by-step
Consistency in social media reports is important — it enables you to compare results throughout time. Use this guide to learn how to build an informative and exemplary social media report in seven steps.
Step 1: Define goals and audience
Set SMART goals to guide your reporting and derive key performance indicators. SMART stands for Specific, Measurable, Achievable, Relevant, and Time-bound goals. These goals help you evaluate and analyze your performance rather than just log it.
For example, “Increase Instagram followers by 15% within the next quarter” is a SMART goal you can easily track and break down into tasks, while a vague goal like “Get more followers” gives little to no certainty.
Besides goals, dive into your target audience’s behaviors, preferences, and online activity patterns. This data can help you shape the social media strategy and determine which metrics are most important and illustrative to track.
Step 2: Select and gather metrics
Metrics are many, but which ones are the ones?
Focus on data that aligns with your defined goals: if you aim to increase brand awareness, concentrate on reach and impressions, and if you target engagement, focus on likes, comments, shares, and engagement rate.
Content analytics dashboard in Planable
Sourcing data from each social media platform manually will take forever, though. Social media analytics tools like Planable can help you speed it up. Planable gathers the necessary metrics across various social media platforms into a single dashboard. Neat!
Step 3: Analyze performance and derive insights
Metrics are just numbers until you give them context. Dive into the data using techniques such as segmentation and cohort analysis.
For instance, by segmenting users by demographic factors like age or location, you can discover which groups are most engaged with your content.
Tracking how these groups’ behaviors evolve over time helps identify trends and patterns that can refine your social media strategy — such as optimizing your posting times.
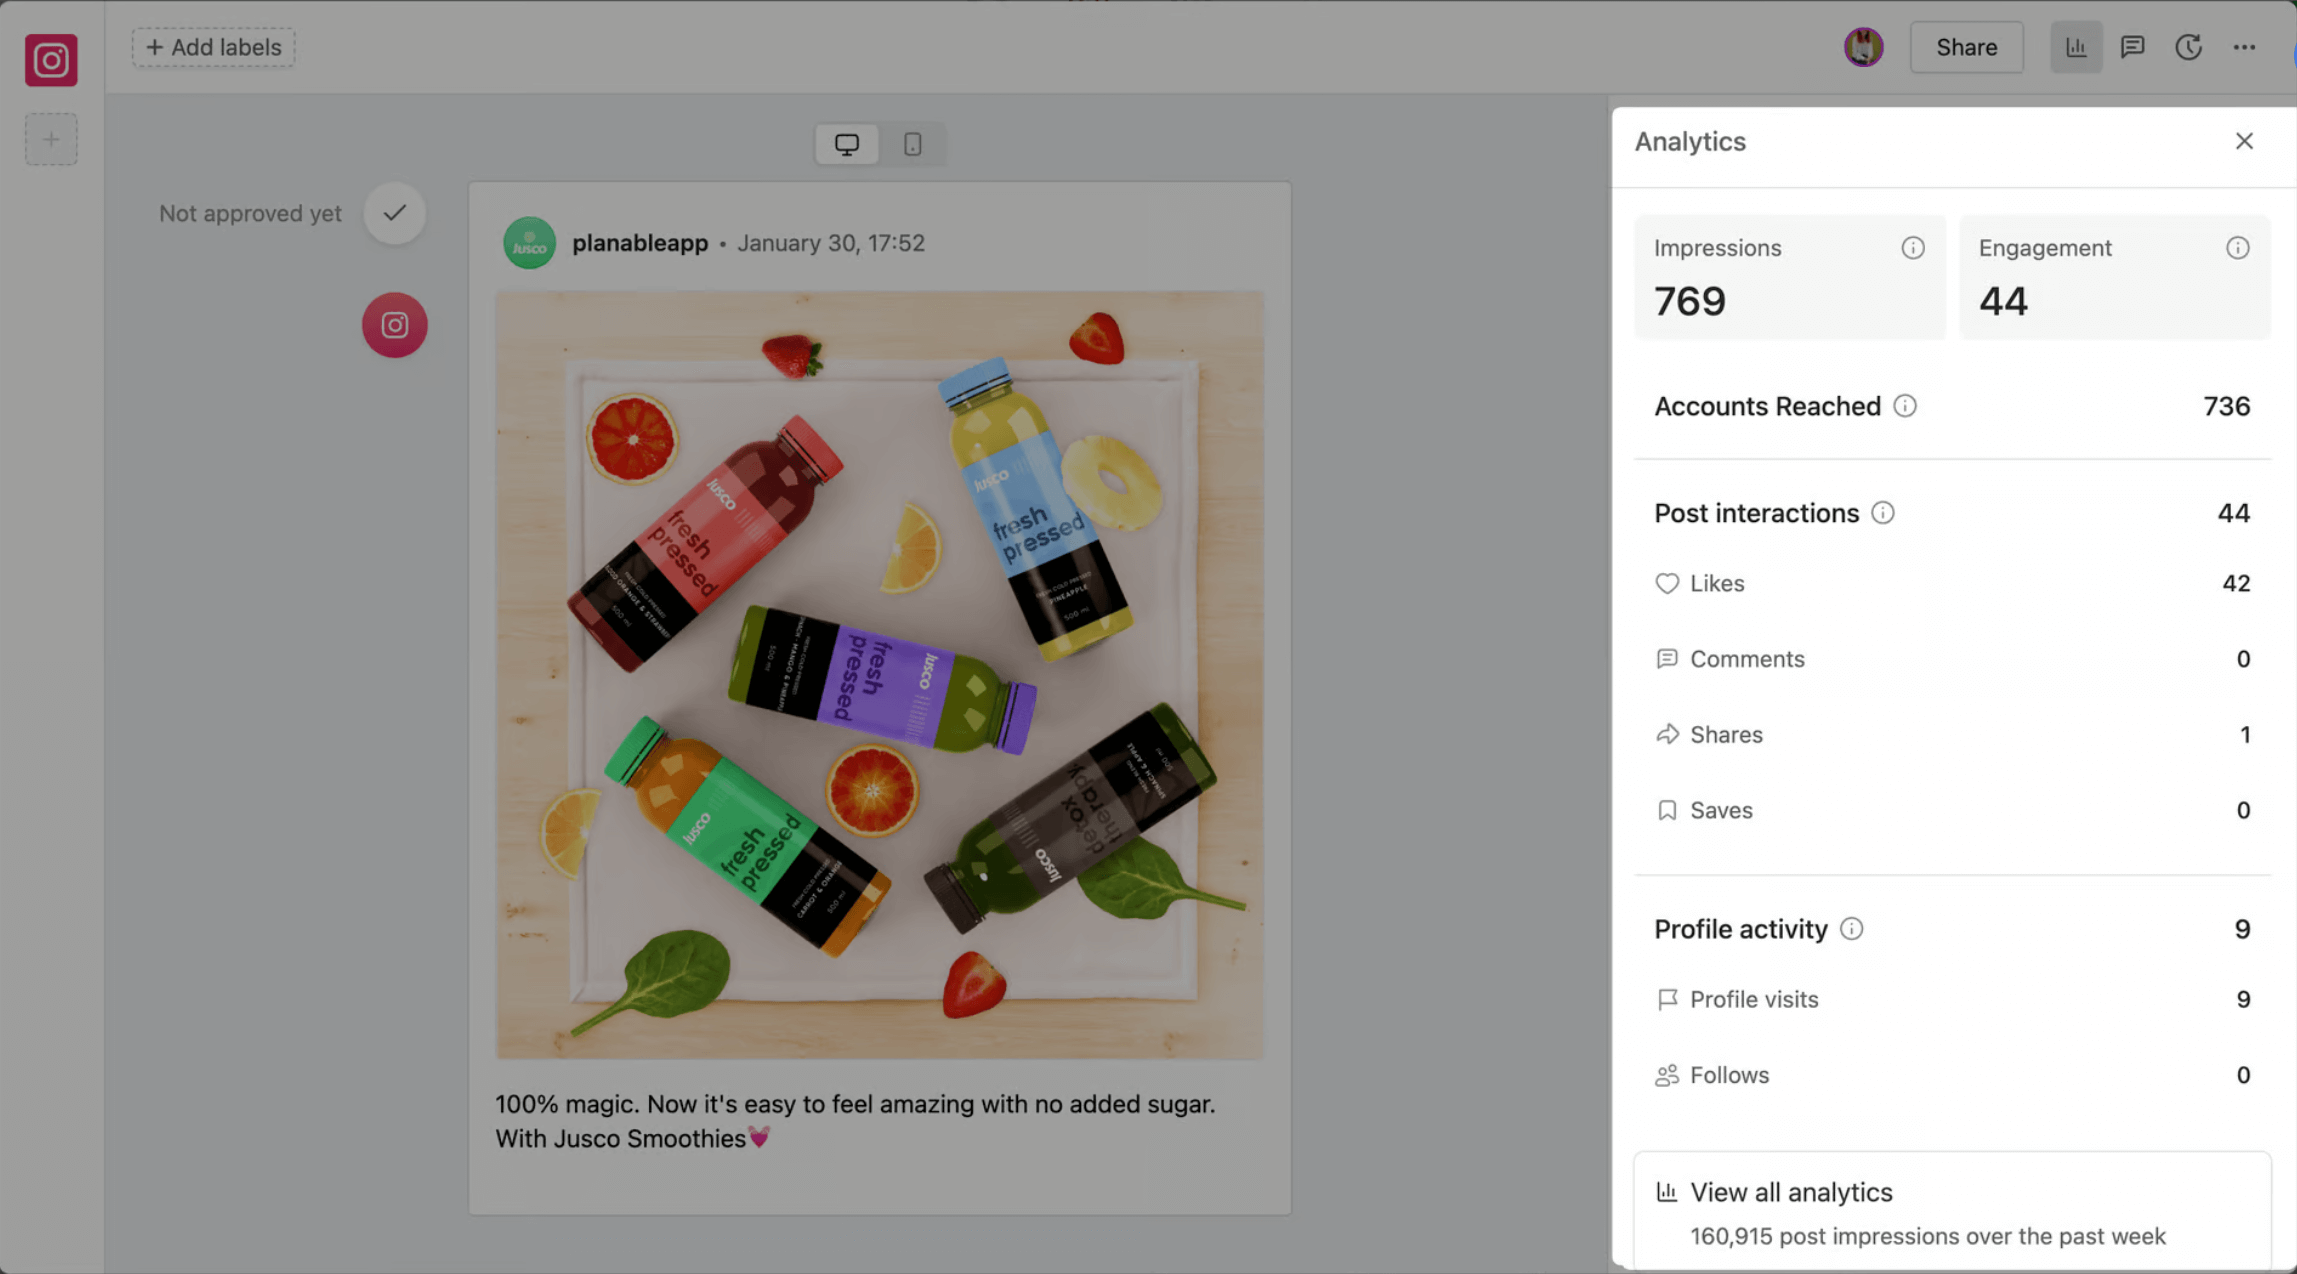
Analytics for an Instagram post in Planable
Planable’s detailed social media reports crunch those numbers for you. These reports not only help observe changes but also enable you and your clients to derive actionable insights from the data.
Step 4: Visualize and compare data
Transform complex data sets into easy-to-understand visuals using graphs, charts, and heatmaps.
Sometimes, stakeholders lack the time to delve deep into the details of a brand’s social media activities. These visualizations help them quickly grasp the impact of your social media efforts without getting in too deep.
Follower growth tracking in Planable
Planable creates visually appealing reports that highlight key performance trends and comparisons across different campaigns or periods. This makes it easier to track progress and tweak the strategy accordingly.
Step 5: Analyze competitors and past campaigns
This can be a good call for quarterly reports, as data about your competitors and previous campaigns helps you benchmark your performance and find opportunities to polish your approach to the next big thing in your social media strategy.
Examine your competitors’ strategies and past campaigns to highlight what’s working. Assess engagement rates, content pillars, and campaign outcomes. Planable can provide historical data back up to 12 months to help you perform a social media audit on your content.
Step 6: Recommend strategies and future actions
Formulate actionable strategies for upcoming activities based on the findings of the social media marketing report. Whether it’s new content pillars to cover, experimental formats, or new social media channels, back them up with data.
Of course, you’ll have to get all stakeholders on board regarding future steps. Planable’s collaboration tools smooth out strategy sessions, allowing team members to contribute ideas and align plans.
Step 7: Summarize key findings and recommendations
Conclude with a concise executive summary that highlights actionable insights and clear recommendations. Support your solutions with data and examples. This final step is especially important for agencies and outsourced specialists who run social media audits for their clients.
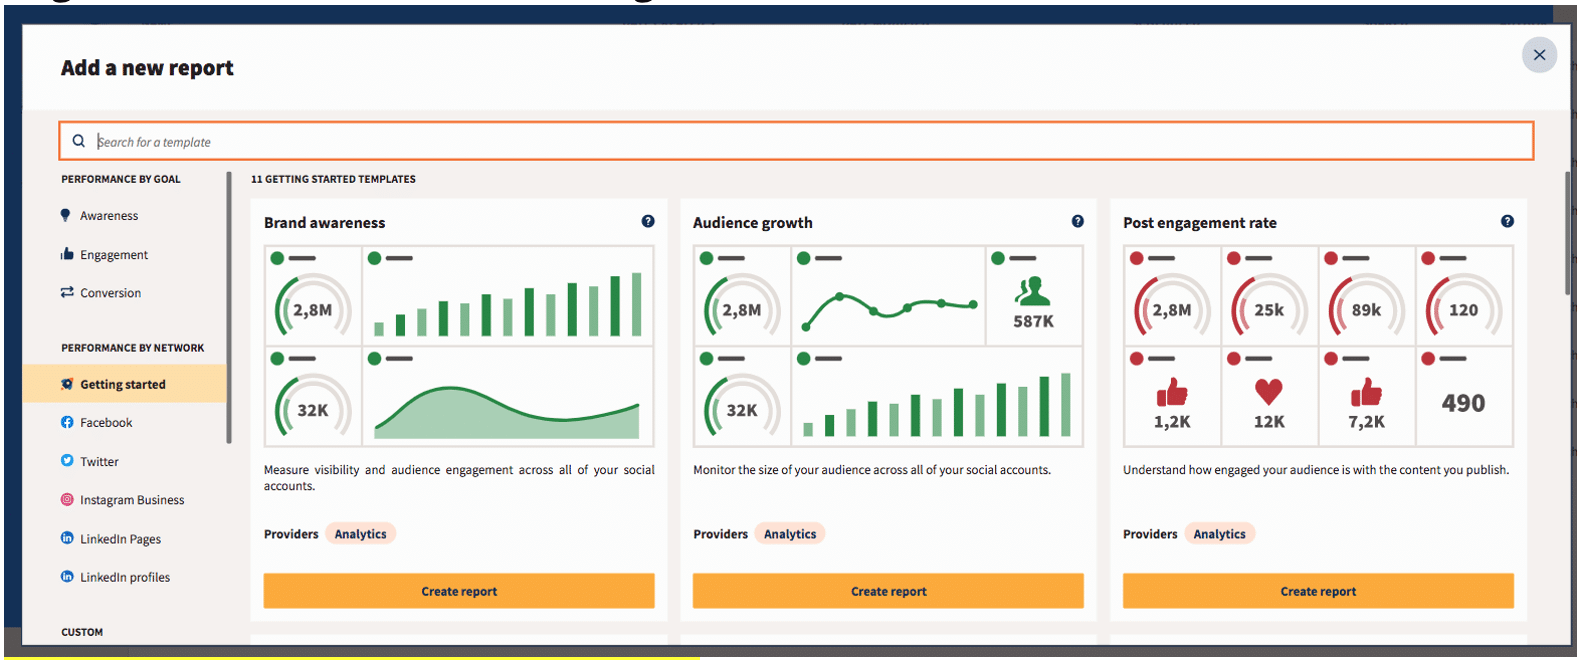
Social media report template in Planable
Planable provides a handy social media reporting template that includes all core metrics. Track your account’s reach and impressions, monitor follower growth, and study the best-performing posts for sustainable success.
Want to see how Planable’s analytics can make your social media reports shine? It’ll walk you through all the cool features and show you how to turn your data into easy-to-understand insights. Just click below and explore how Planable can help you level up your social media reporting.
9 types of social media reports
Your social media report can be monthly,quarterly, or annual. Each period provides specific insights into performance trends and helps you adjust your strategy over time. Some metrics, like follower growth and engagement, are suitable for monthly reports, while ROI is better seen in the longer run, like a quarter or annual report.
Besides the reporting period, you can also differentiate your reports based on the goal and core tracked metrics:
Performance Reports detail the overall effectiveness of social media activities, focusing on metrics like reach, impressions, and engagement to gauge general success.
Engagement Reports concentrate on how audiences interact with content, measuring likes, comments, shares, and overall engagement rates to evaluate content resonance.
Audience Analysis Reports provide insights into your audience’s demographics, preferences, and behaviors, helping you tailor future content and adjust publishing time.
Competitor Analysis Reports compare your social media performance with that of competitors to identify strengths, weaknesses, and opportunities in your strategy.
ROI Reports analyze the financial return on social media investments by linking campaign expenditures to generated revenue, which is essential for assessing financial efficacy.
Campaign Reports evaluate the performance of specific marketing campaigns, focusing on set objectives, social media traffic, utilized budget, and conversions.
Content Analysis Reports review the performance of different types of content across platforms to identify what content works best and why, focusing on metrics like engagement and conversion rates.
Customer Service Reports assess the effectiveness of social channels as customer service channels, tracking response times, resolution rates, and customer satisfaction.
Influencer Performance Reports monitor the impact of influencers on your campaigns, measuring reach, engagement, and conversions attributable to influencer collaborations.
Best social media reporting tools
1. Planable – best social media management tool with analytics
Planable is a social media management platform that helps you leverage the collective creativity of your social media team. You can create and collaborate on any written content and schedule and manage posts for all major social platforms.
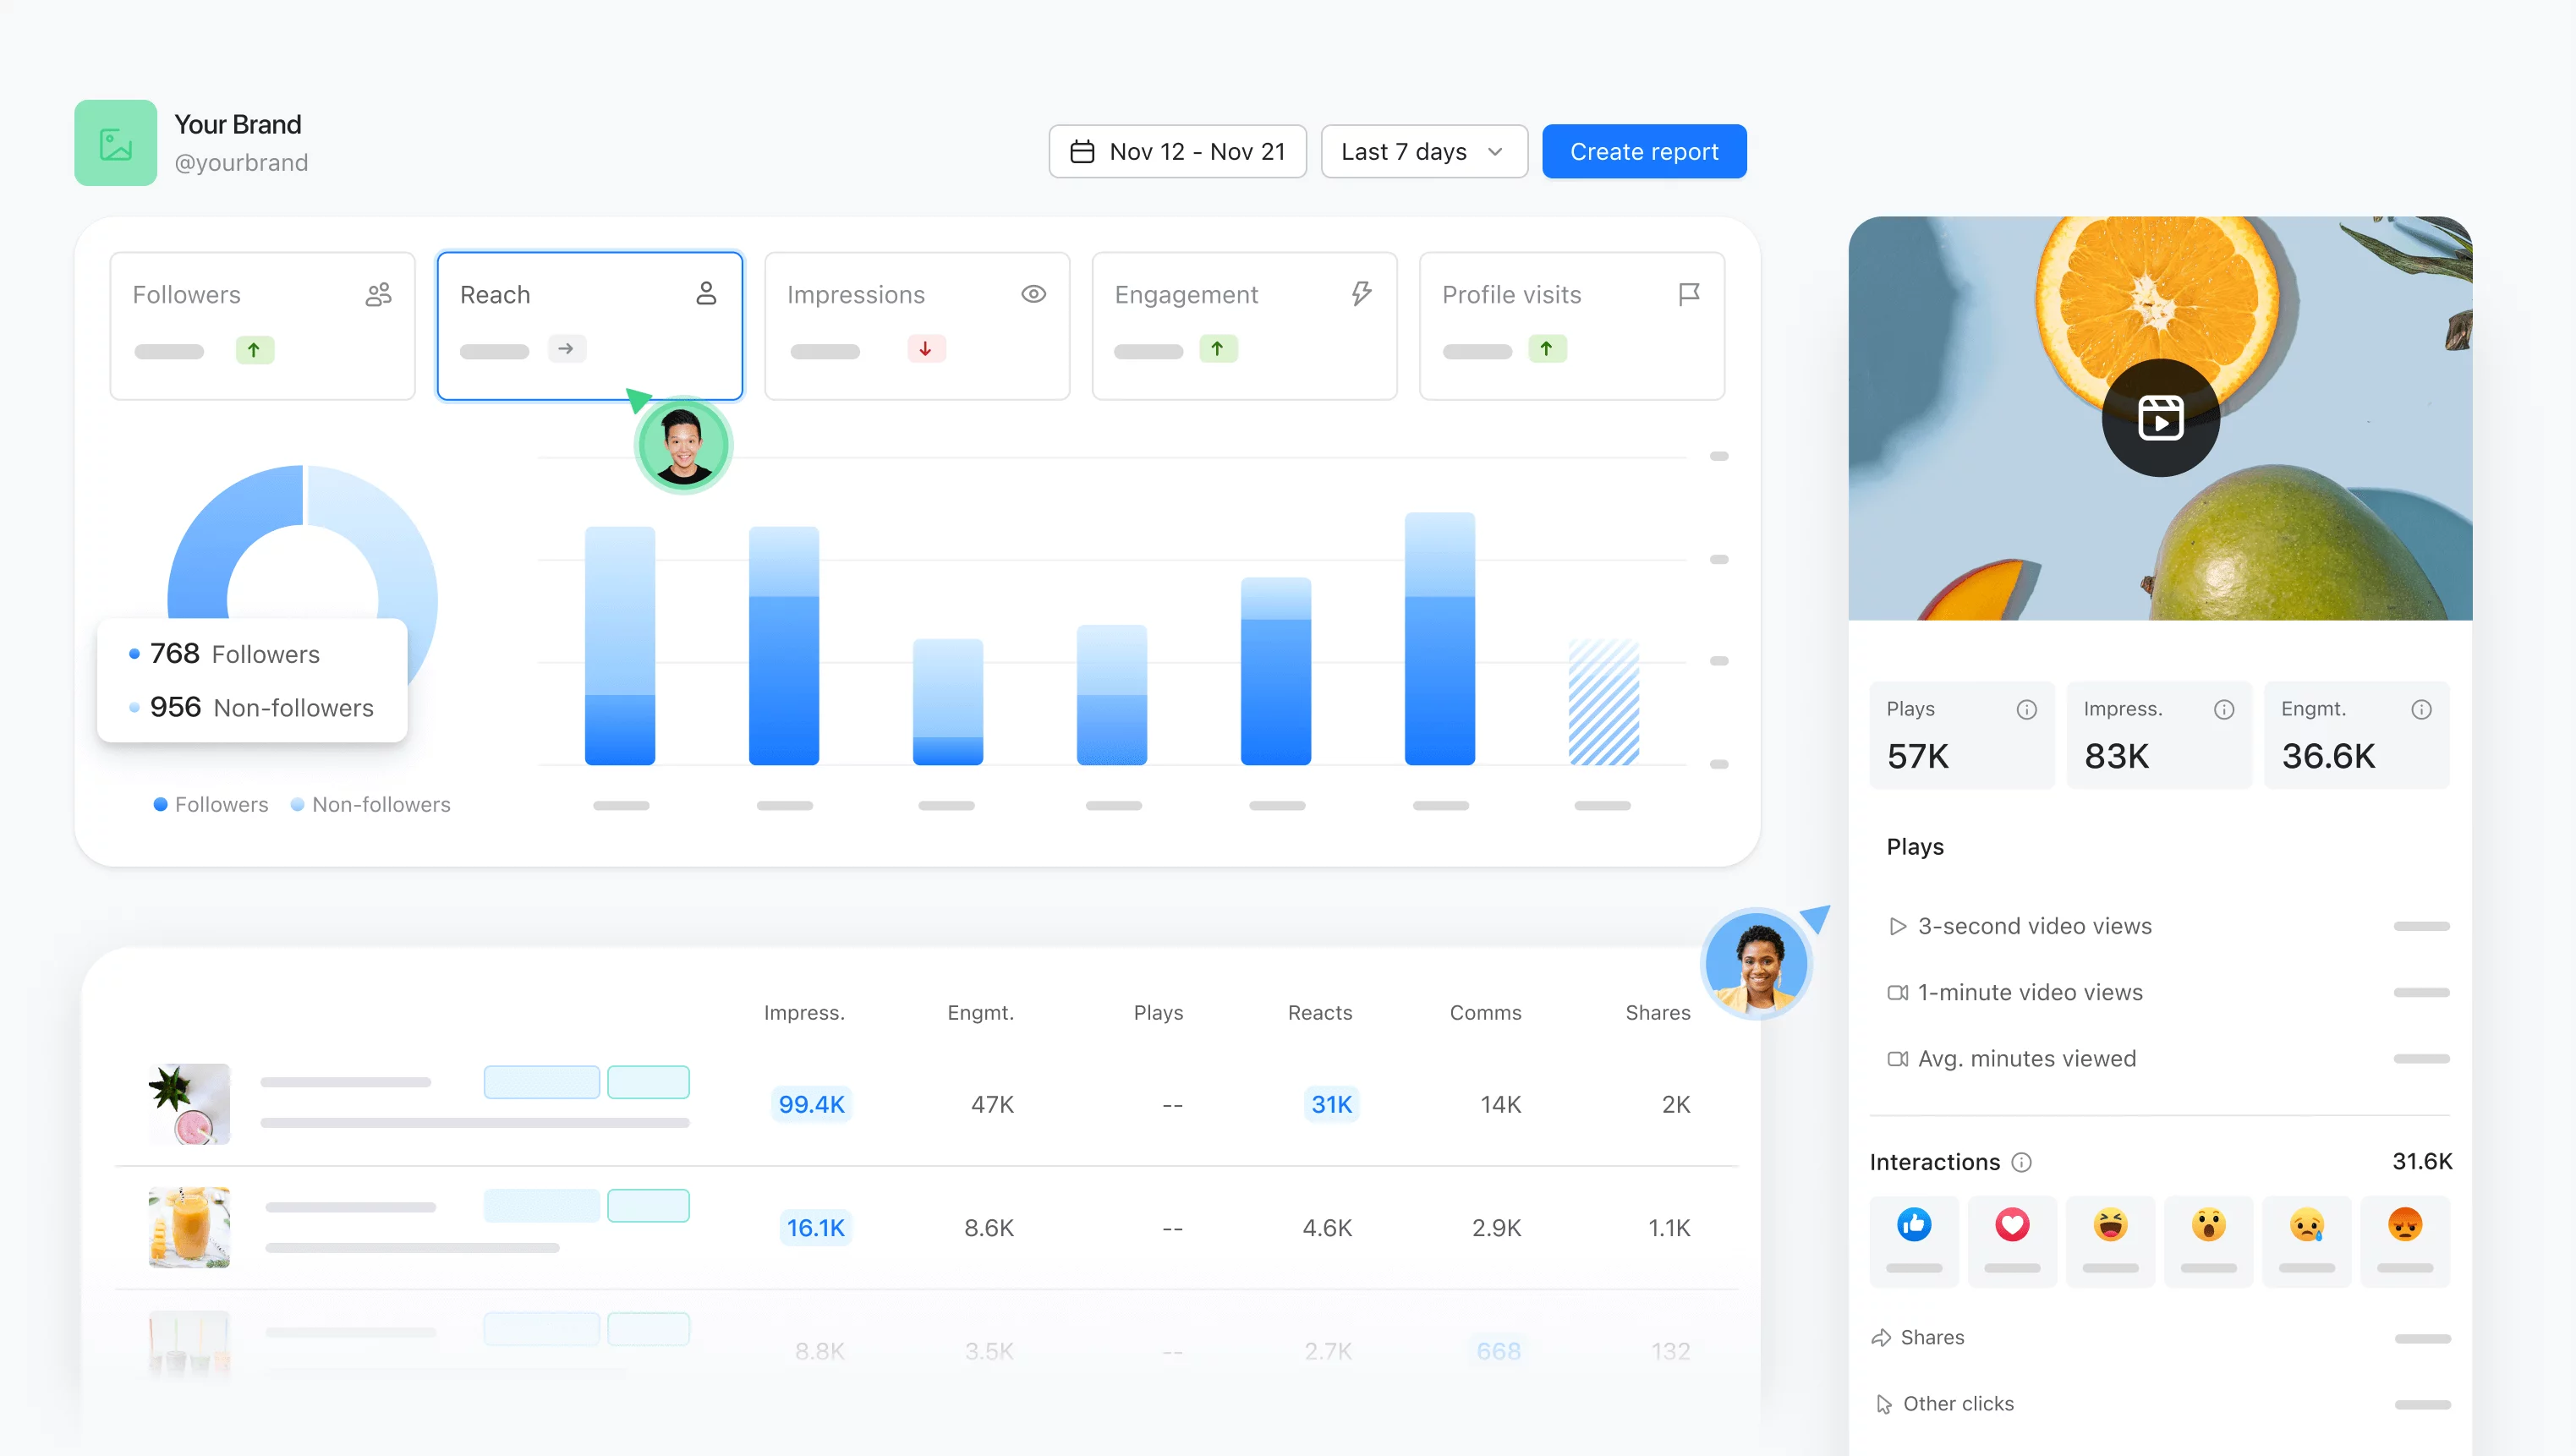
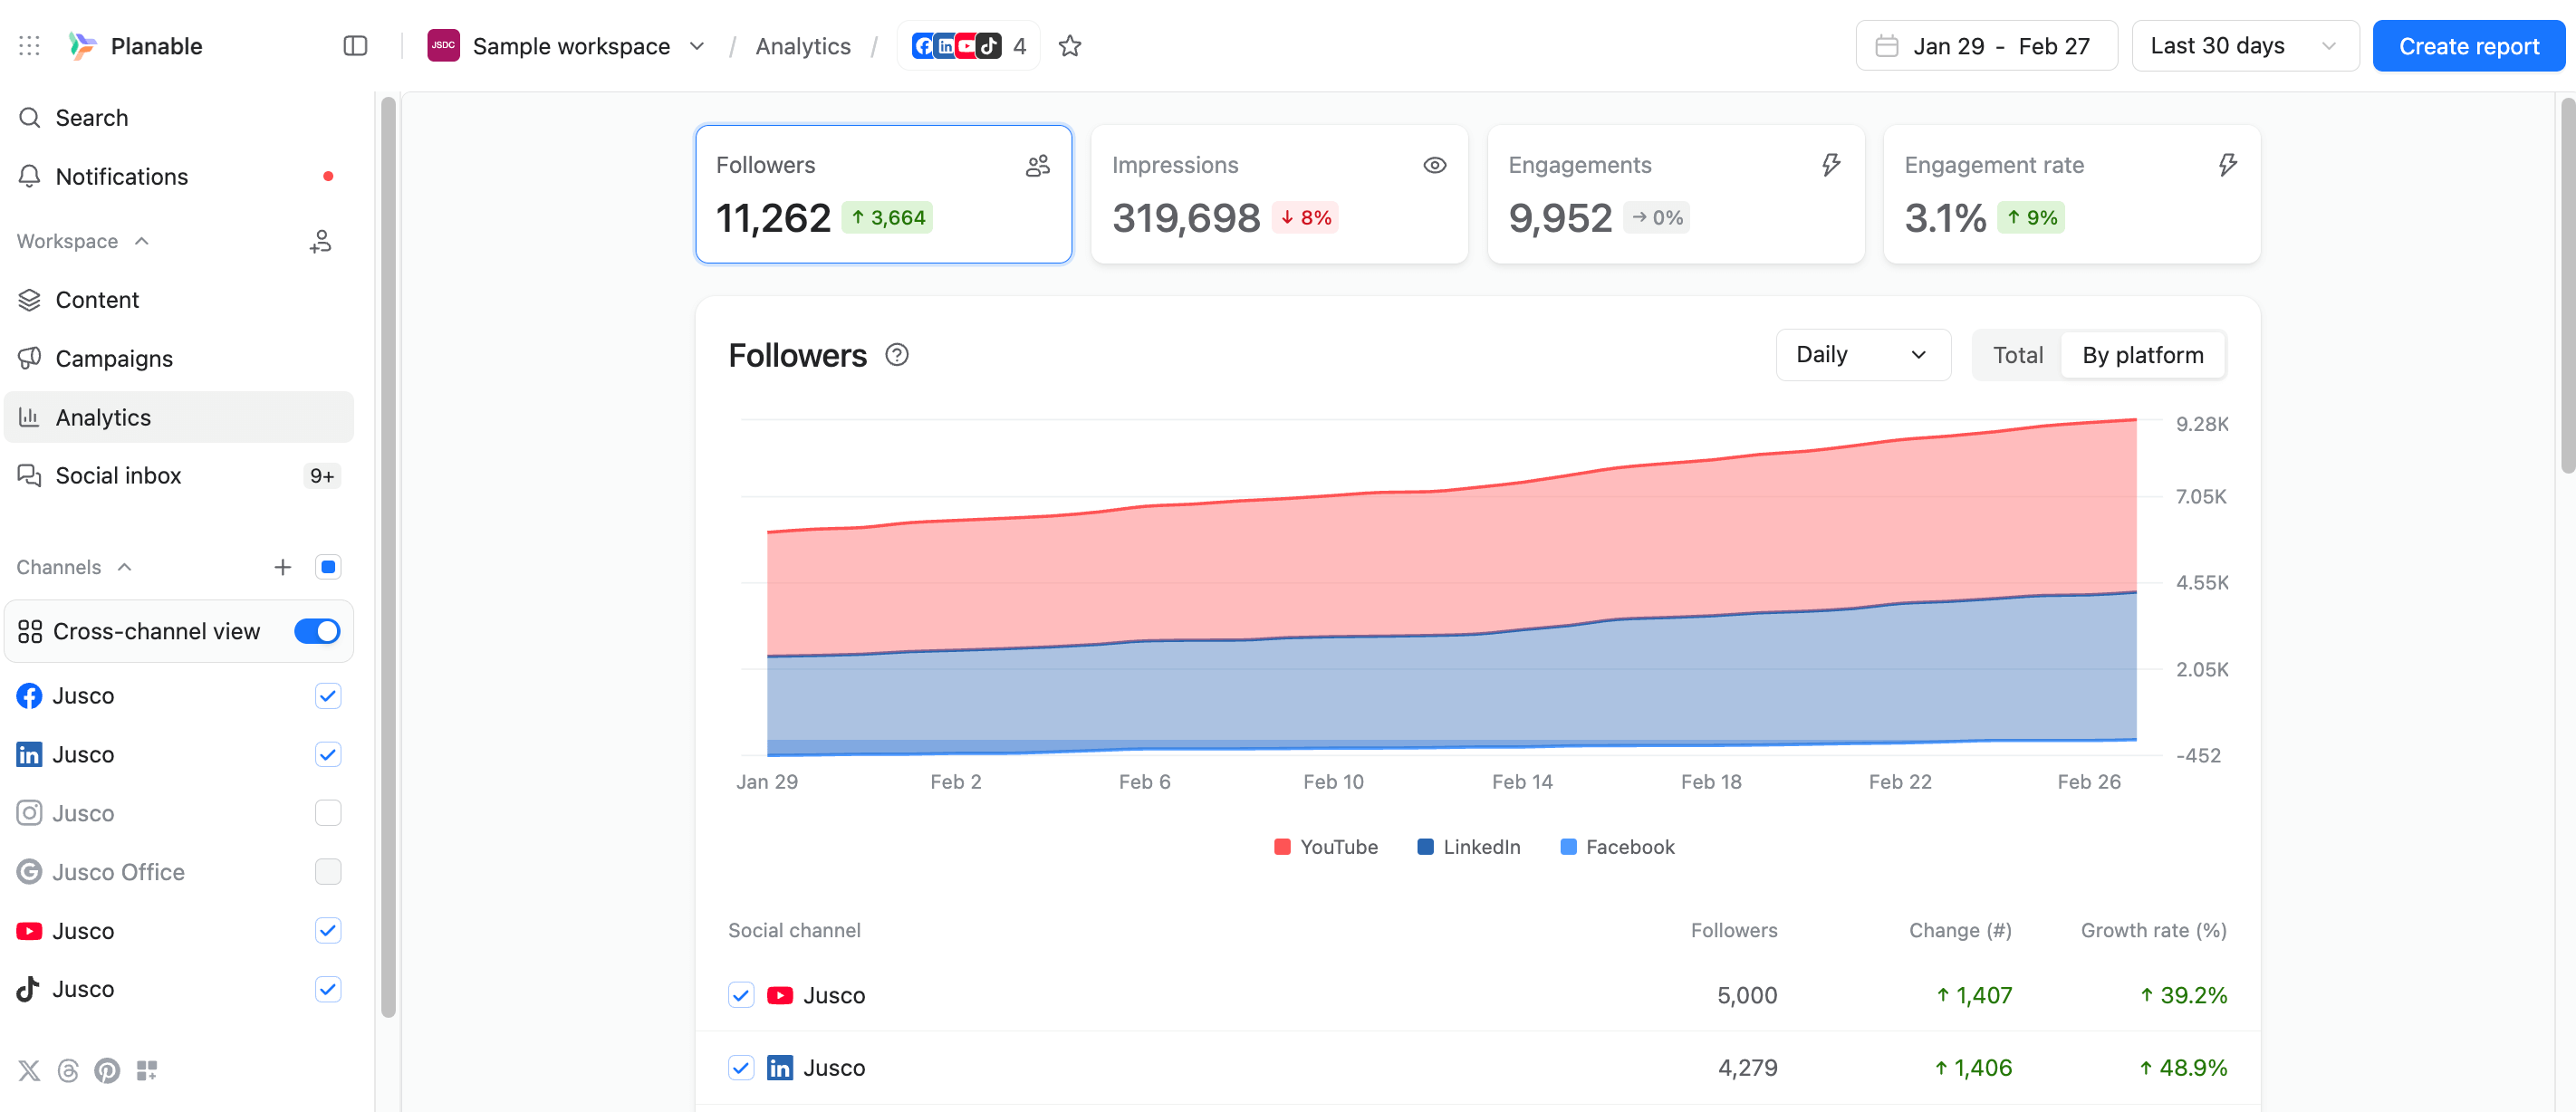
Planable analytics view with cross-channel followers, impressions, and engagement rate overview
On top of this, Planable’s built-in analytics tools help you analyze your performance on Facebook, LinkedIn, TikTok, Instagram, YouTube, and Google Business Profile.
Planable Analytics key features:
Track account statistics
Monitor account-level data over a custom date range. Compare platforms or pages side by side and review key metrics such as follower growth, posts published, engagements, impressions, and profile visits, all aggregated in one place.
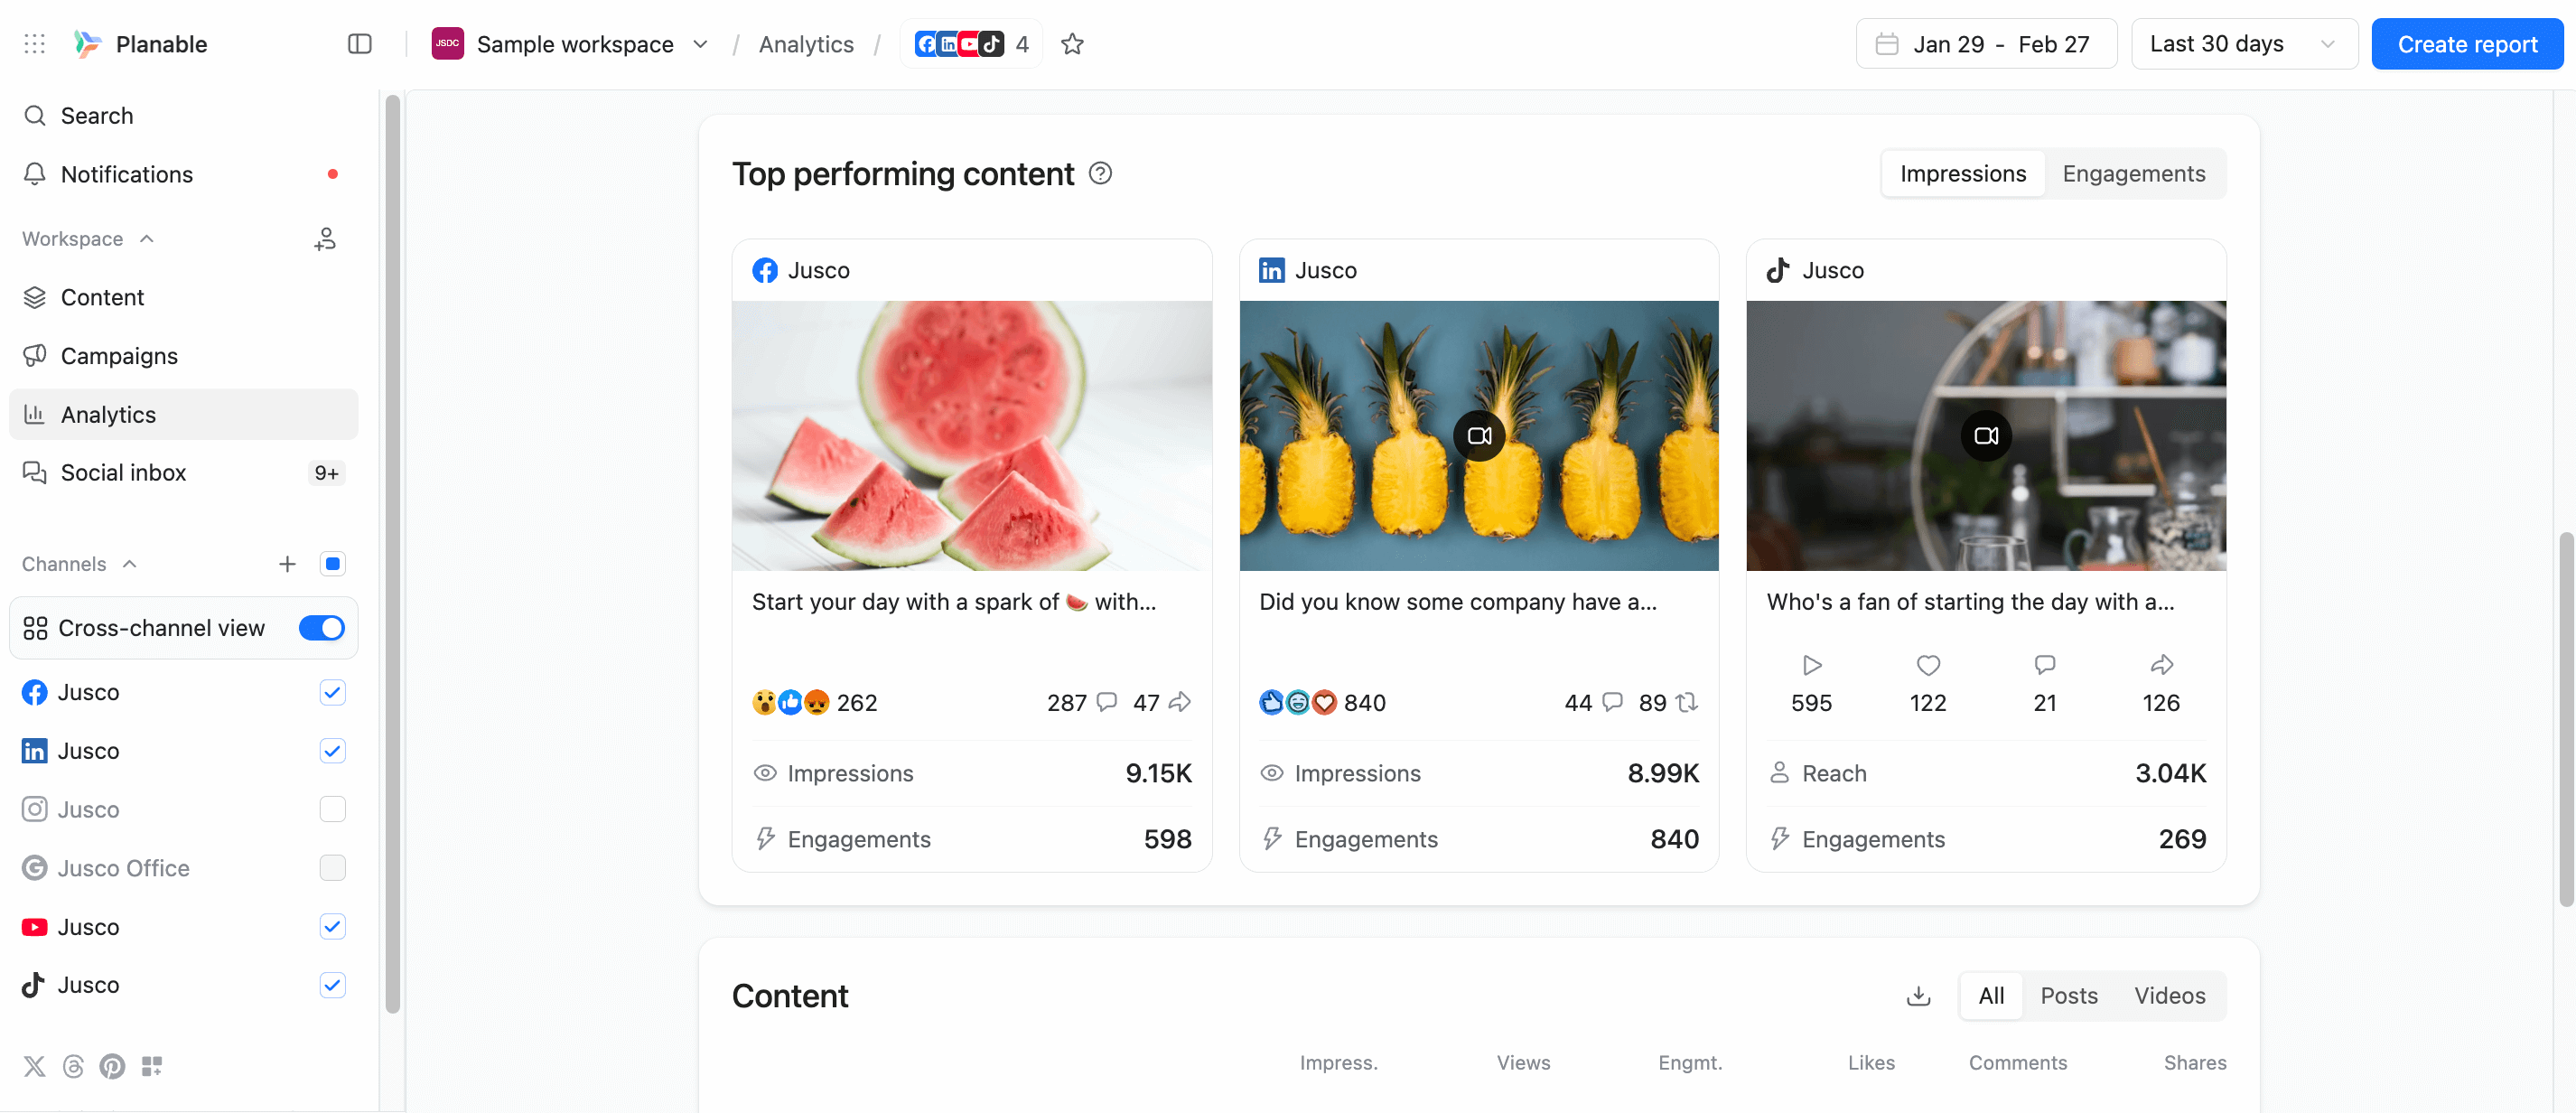
Identify top-performing posts
Instantly surface your top performing posts based on engagement, impressions, or other key metrics. No manual sorting required, because Planable Analytics highlights what delivered results.
Planable top performing content report with cross-channel post metrics and engagement stats
Get in-depth insights
Dive into detailed metrics for each piece of content, including engagement, likes, impressions, shares, clicks, and more (even for content published natively). Use these social media insights to understand what drove performance and refine your next steps.
Understand your audience
Access audience insights such as location, demographics, and professional information to better align content with the people you’re trying to reach.
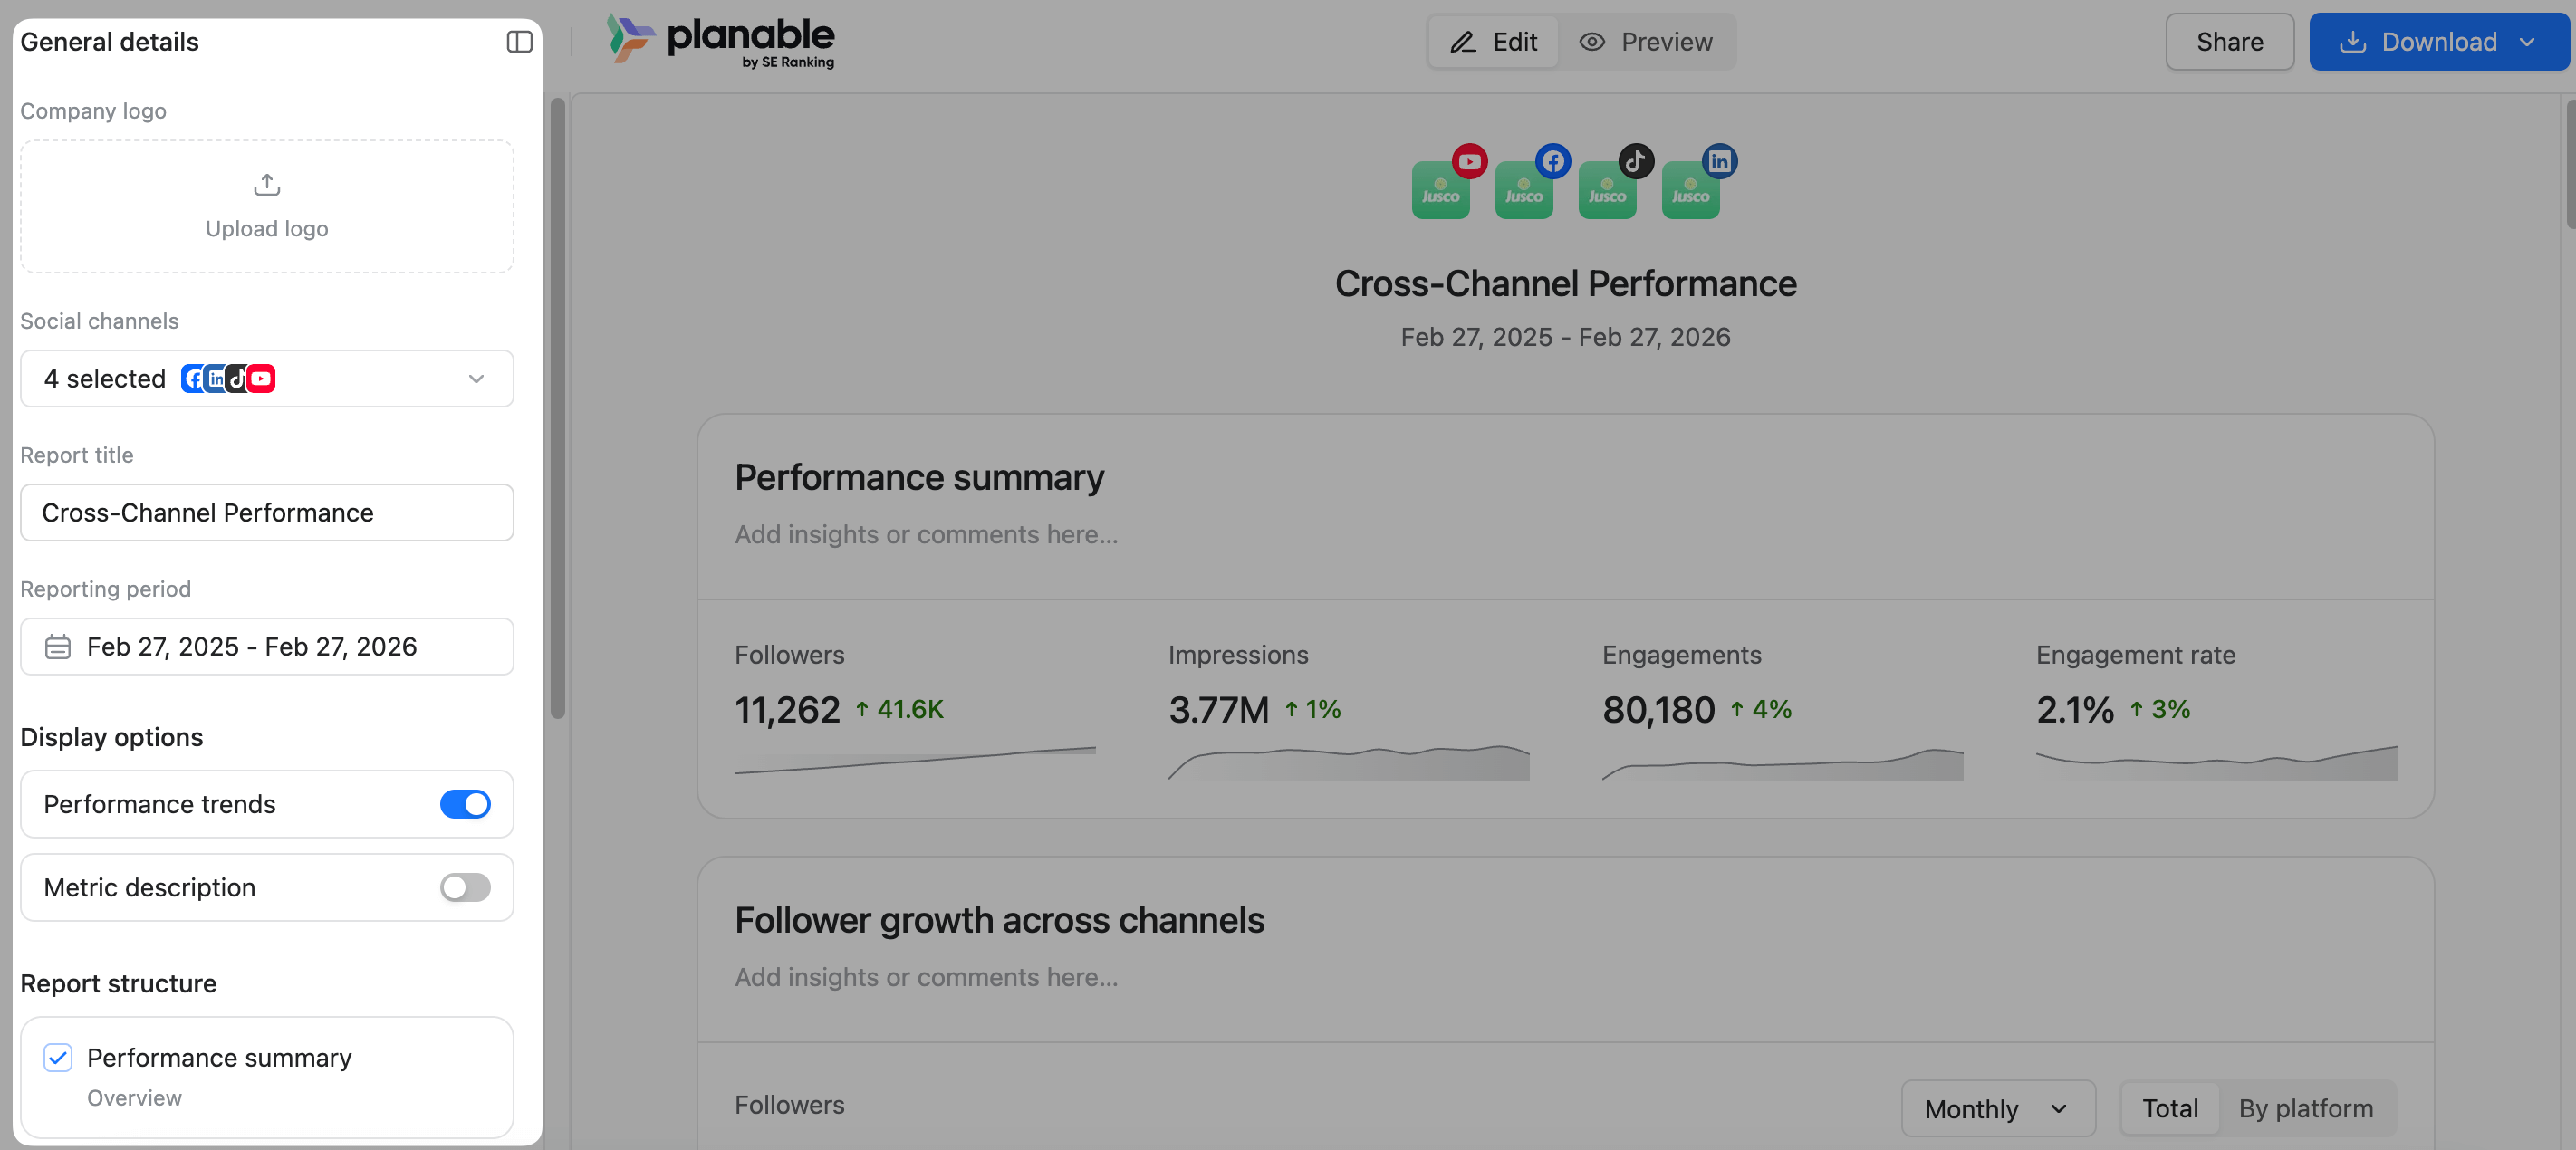
Generate reports
Create customizable reports with performance trends and metric descriptions included. Compare results across channels, highlight top posts, and share reports as downloadable files or secure share-links in just a few clicks.
Planable customizable report view
2. Hootsuite – best social media management tool with social listening
Hootsuite is a versatile platform that allows businesses to manage their social media presence efficiently from one central dashboard.
Its main features include:
Comprehensive analytics dashboard. View performance metrics like engagement, reach, and conversions across multiple platforms to understand the effectiveness of your strategies.
Social listening. Enrich your reports with insights into what people say about your brand online.
ROI calculation. Measure the return on investment from your social campaigns to determine their financial impact directly.
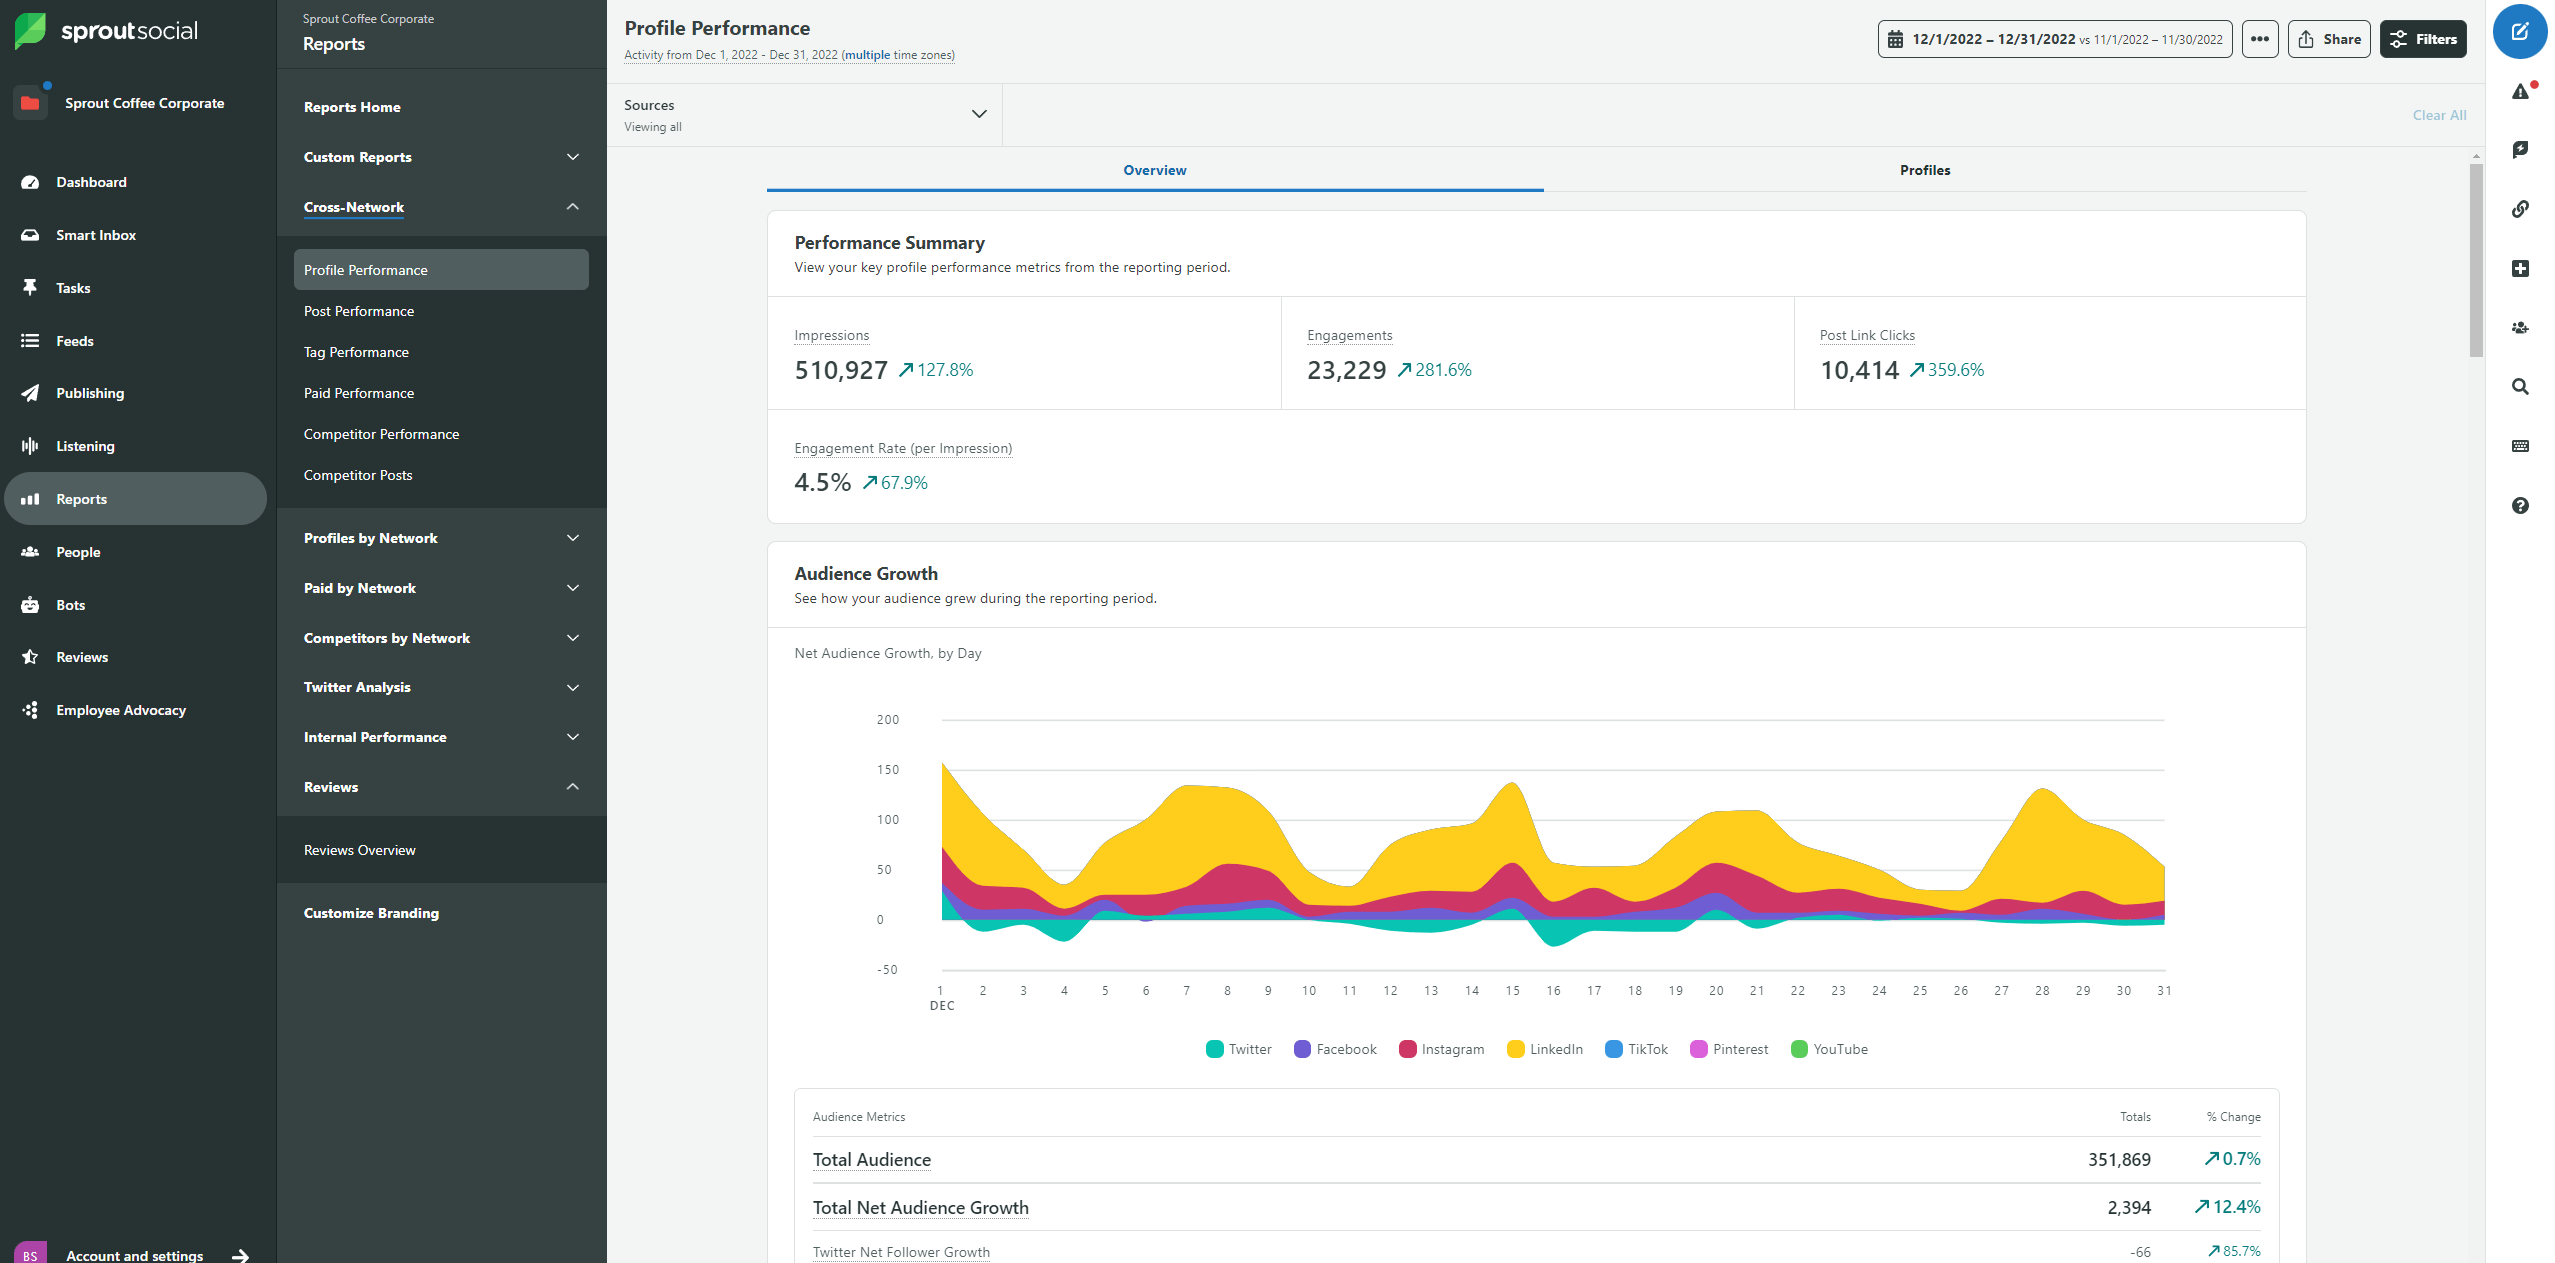
3. Sprout Social – best analytics tool for big companies
Sprout Social stands out with its sophisticated analytics capabilities (and relatively high price), making it a good choice for big agencies and businesses focused on data-driven strategies.
Its main features include:
Trend analysis. Utilize trend reports to stay ahead of industry shifts and adapt your strategy accordingly.
Sentiment analysis. Gauge public sentiment and emotional reactions to your posts to understand consumer behavior and response patterns better.
Competitor benchmarking. Compare your social media performance against industry benchmarks or specific competitors to identify areas for improvement.
Best practices for social media reporting
To take your social media reporting to the next level, follow these best practices:
Align metrics with goals. Focus on metrics that directly align with your business objectives. This ensures the data you collect and analyze is relevant and actionable.
Update reports regularly. Ensure your social media reports are updated regularly (weekly, monthly, quarterly) to capture the most relevant data and trends. Timely updates allow you to stay flexible and react to red flags in real time.
Be ready to act on data. Reports reflect the state of your strategy, and sometimes, you have to pivot based on the results. Use the insights to refine and adjust your strategy — if certain tactics are not yielding expected results, pivot or optimize them.
Revise content types and formats. If certain types of content perform better than others, prioritize these formats in your future content planning.
Benchmark your performance. Compare your metrics to industry standards, competitors, and previous results. Use these insights to set realistic goals and make strategic improvements.
What should a social media monthly report include?
The essential monthly social media report should include:
Engagement metrics: track likes, comments, and shares to gauge content interaction.
Reach and impressions: measure visibility and frequency of content exposure.
Follower growth: monitor monthly changes in follower numbers.
Top-performing posts: highlight content that garnered the most engagement.
Conversion metrics: track specific actions taken from social media content, such as link clicks that lead to sign-ups or sales.
Create social media reports that stun
Social media reporting is crucial to your success on social media. Reports help you comprehend and communicate the metrics to your higher-ups and clients to forge a better strategy and make data-driven decisions.
Looking for a way to ease this process for your marketing team? Try Planable to create, analyze, and share stellar social media reports. Grab 50 free posts to give it a try today.
Content marketer with a background in journalism; digital nomad, and tech geek. In love with blogs, storytelling, strategies, and old-school Instagram. If it can be written, I probably wrote it.