The chart dips, and many social media sentiment analysis tools stop right there: the reply happens in another inbox, and the client or location report gets rebuilt by hand somewhere else. Scoring the mood is the easy part of social media sentiment analysis. The...
Redesign For multi-location brands
all your locations, one content flow
For multi-brand companies
content collaboration at scale
For agencies
impress your clients and take on more
“The team loved it from the start. Planable helps us overview the entire marketing efforts.“
Your results are good. Proving them shouldn’t be painful.
Most social media reporting means hopping between platform dashboards, copying metrics into spreadsheets, and reformatting slides for clients. That time goes into logistics instead of analysis.
Planable Analytics brings performance data into the same workspace where you plan, collaborate, and publish. Metrics connect back to the content that produced them, so when someone asks, “Is this working?”, you can answer with a clear, consistent report.
See all your channels in one place
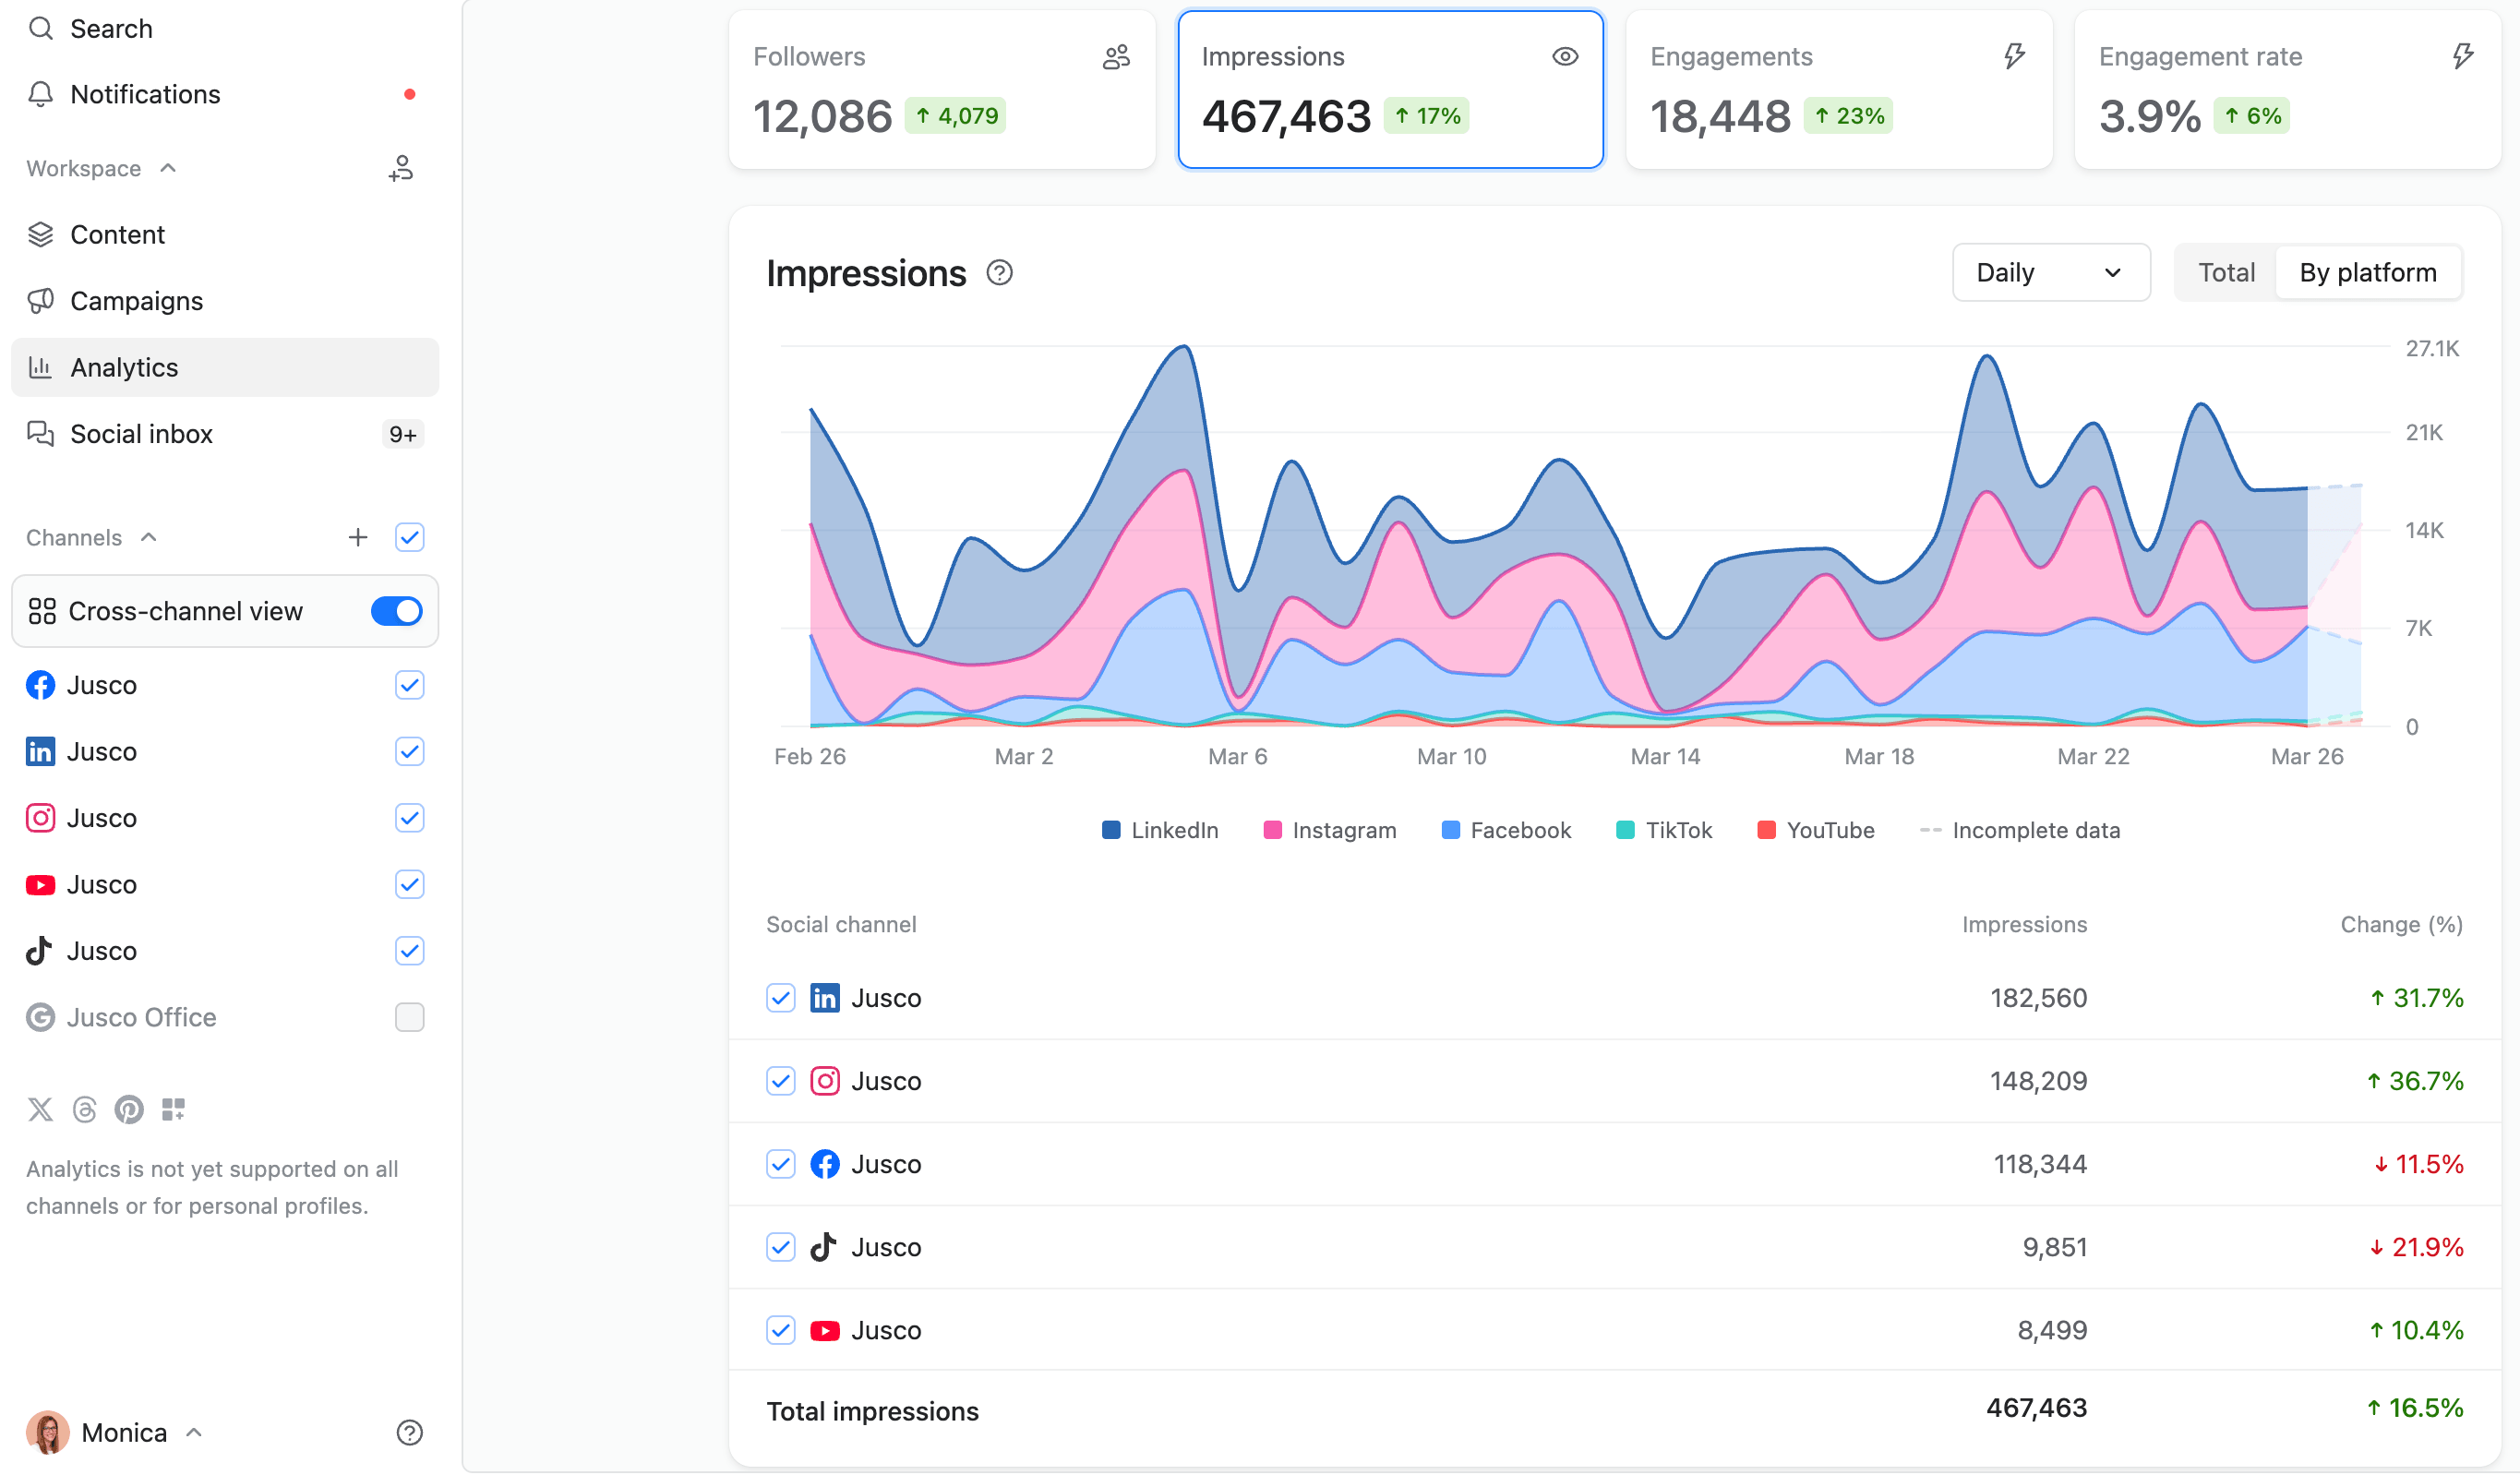
Cross-channel analytics view in Planable with impressions and engagement trends
Teams rarely manage a single network. Planable Analytics shows a cross-platform dashboard for Facebook, Instagram, LinkedIn, TikTok, YouTube, and Google Business Profile, so you can:
Compare performance across channels without switching tabs
Track trends over time (growth, reach/views, engagement)
Spot where results are improving or stalling, faster
Find the content that’s actually driving results
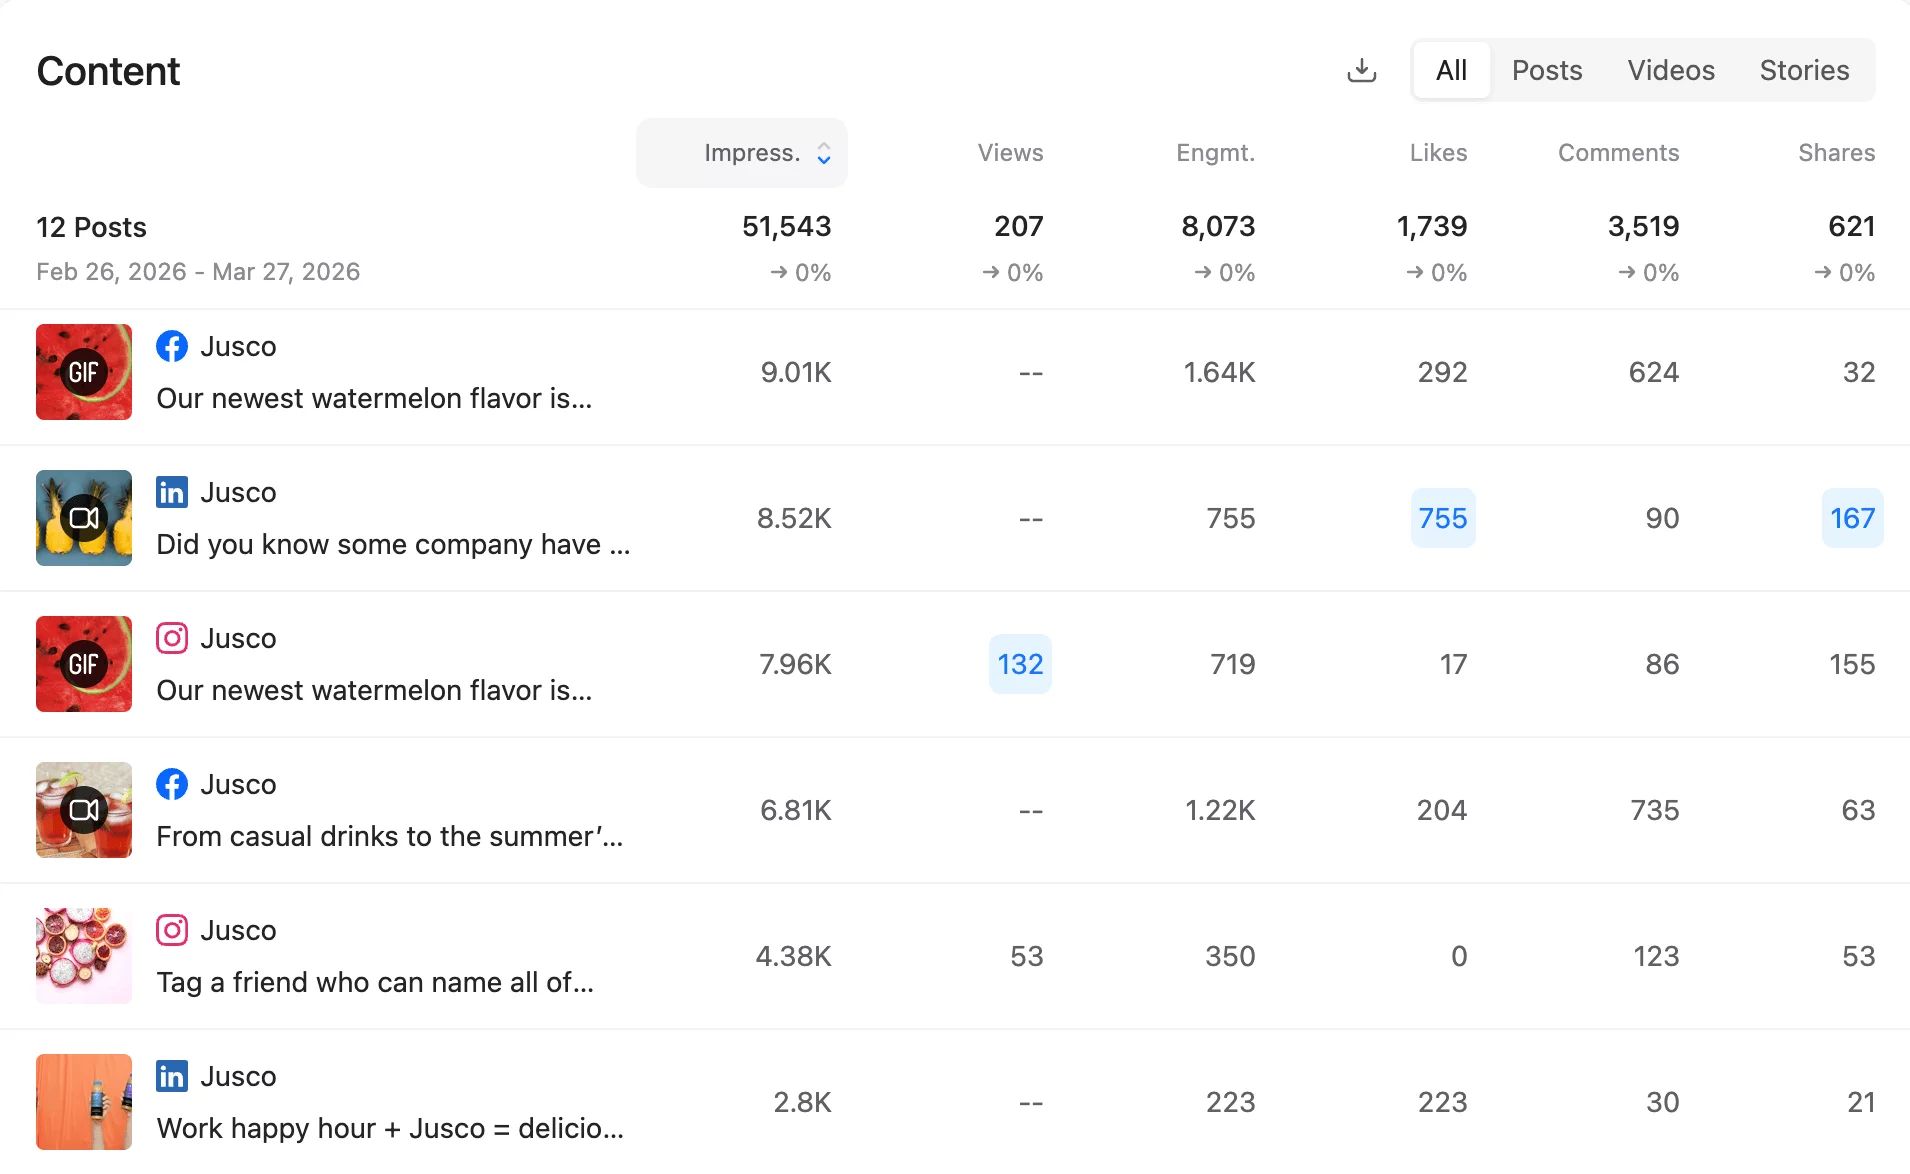
Top posts ranked by impressions with engagement metrics in Planable
Overall reach is helpful. Knowing which posts drove it is what changes your strategy.
Planable Analytics surfaces top-performing content across your channels for any time period. In the content view, posts are ranked and the top performer for each metric is highlighted, so you can quickly identify:
What performed best (engagement, reach, views)
What underperformed (and which metric it missed)
Patterns worth repeating (format, topic, timing)
Understand who you’re reaching, not just what you got
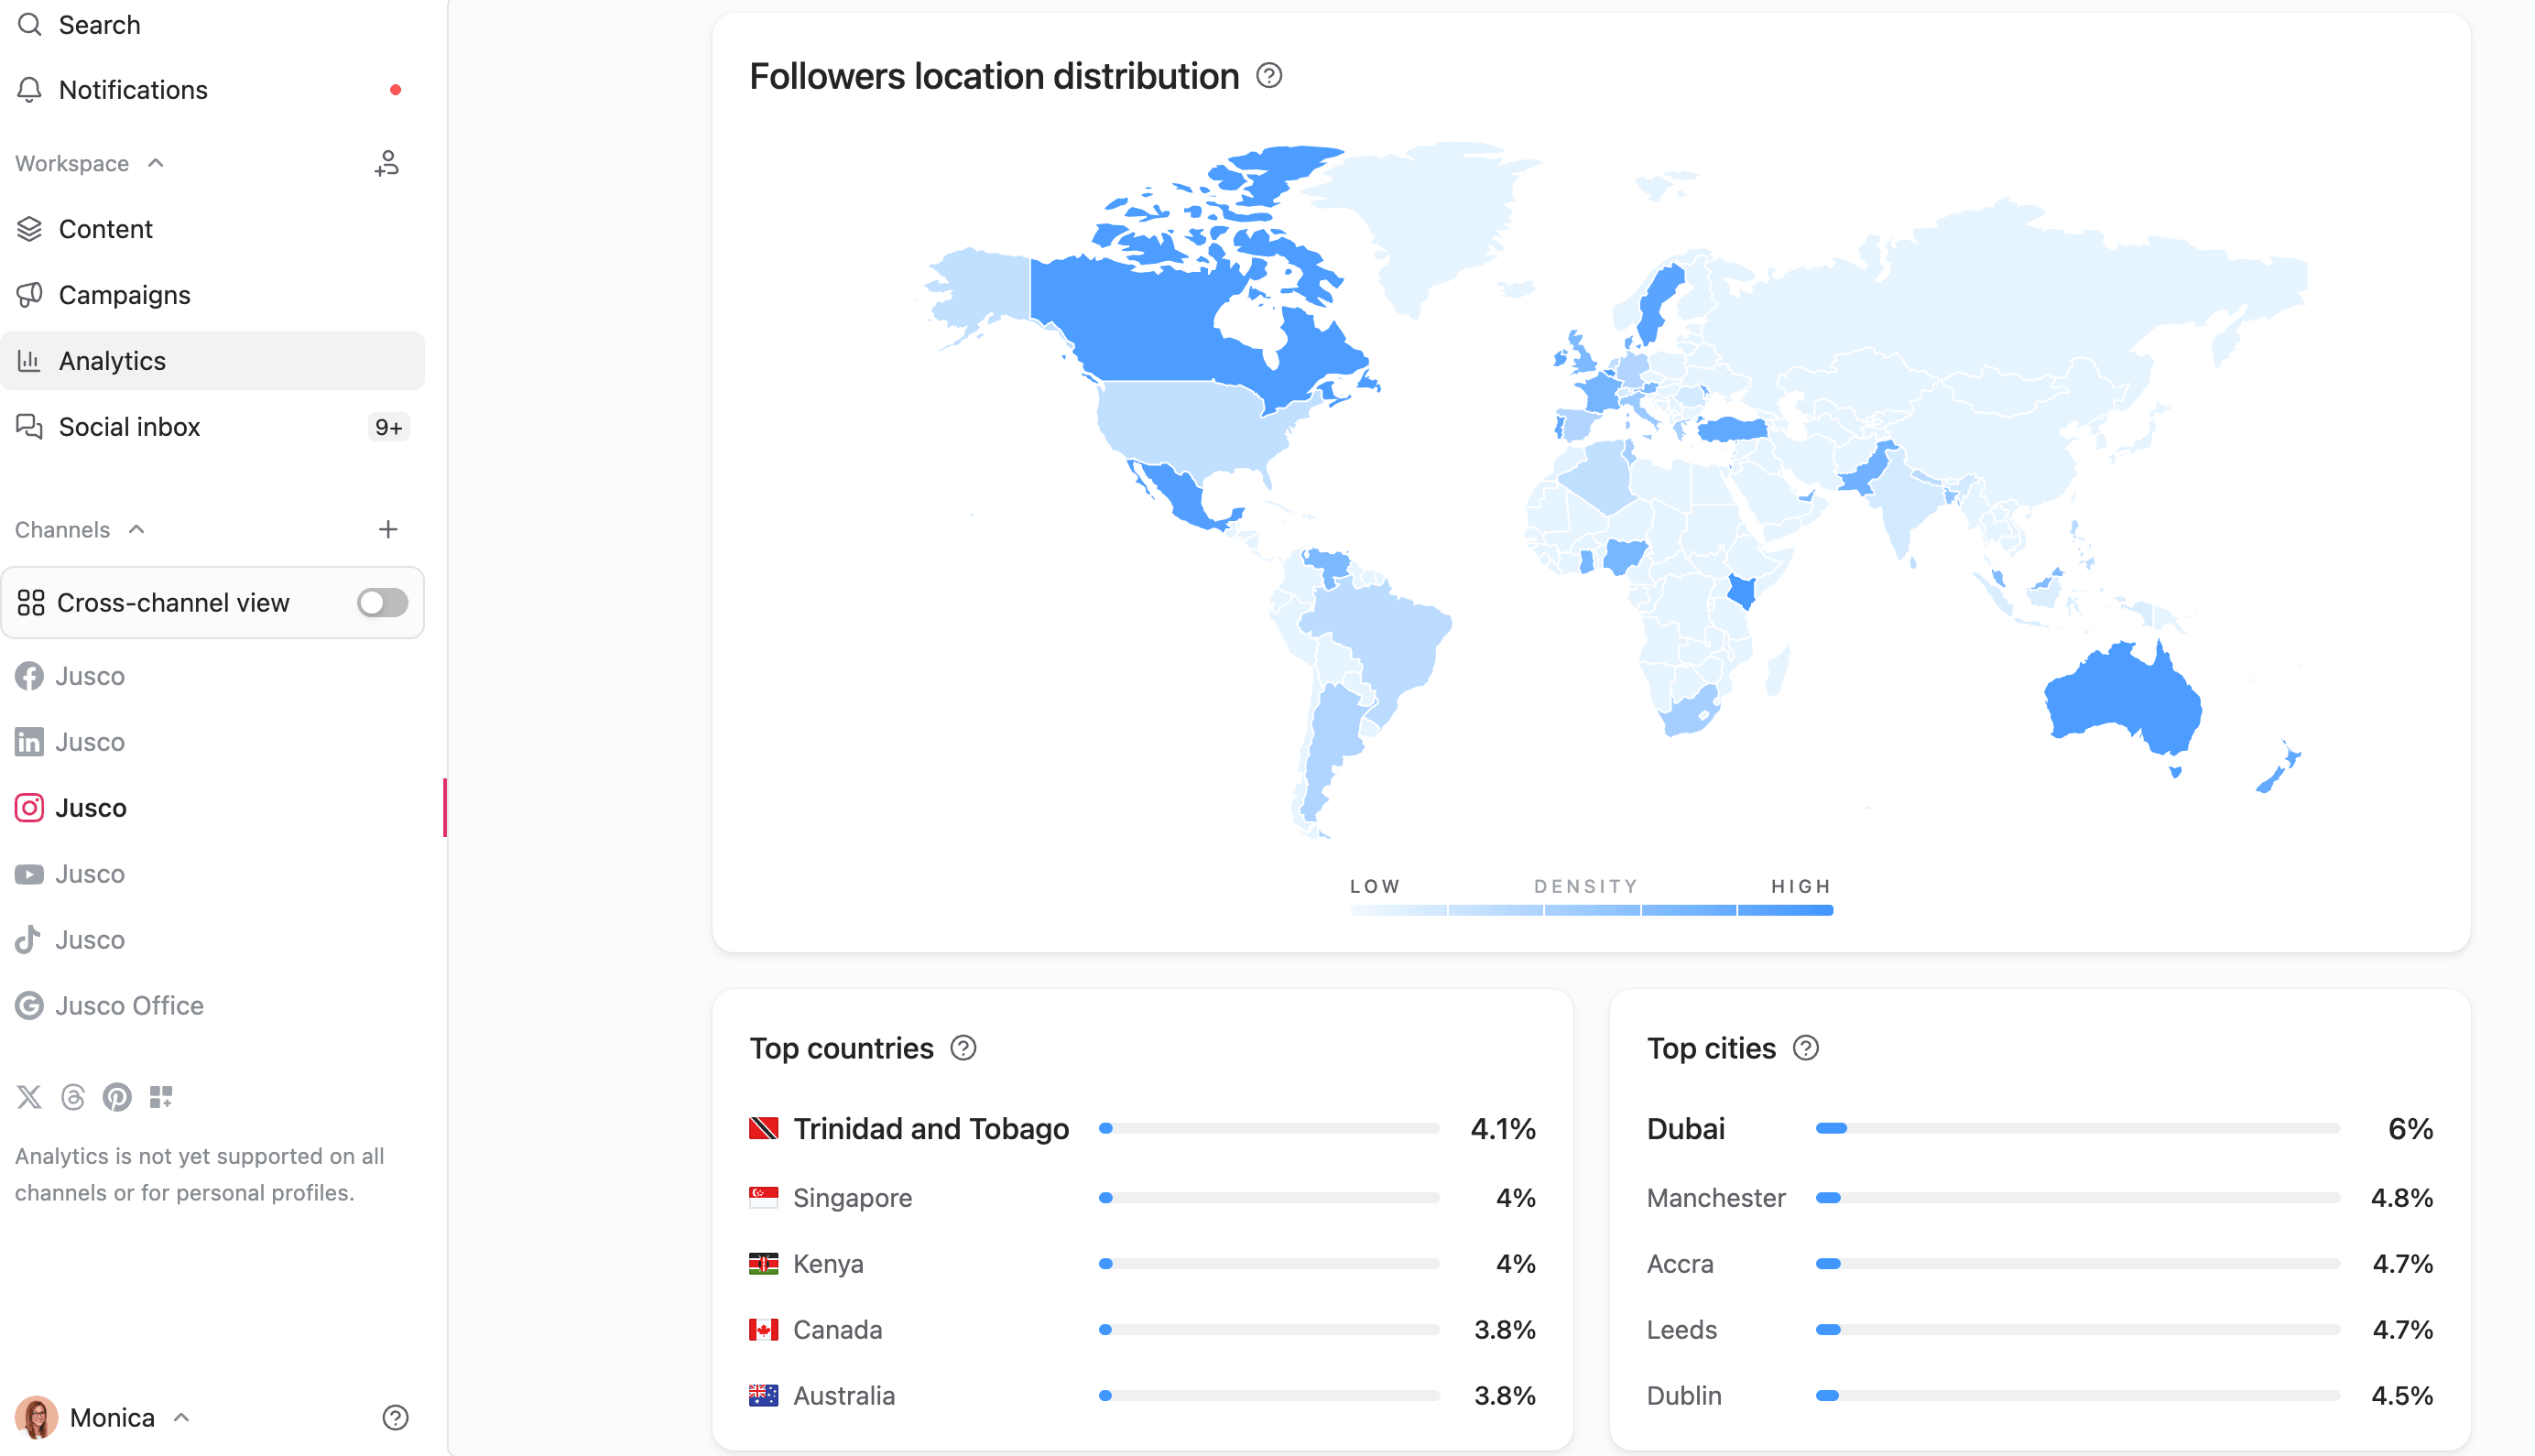
Map showing follower locations and geographic distribution in Planable
Performance metrics explain what happened. Audience Insights explain who it happened with.
For Instagram, LinkedIn, and TikTok, Planable Analytics provides follower demographics, including:
Location (country and city, shown on an interactive map)
Age distribution
Gender breakdown
For LinkedIn, you also get professional context that matters for B2B strategies:
Industry
Career level
Seniority
Client-ready reports that include context, not just charts
Reporting should be quick to produce and easy to trust.
With Planable’s report builder, you can create a single report from multiple platforms. You choose channels, set the reporting period, and include only the sections you need. You can also add notes to explain:
What drove a change in results
What changed mid-campaign
What the numbers mean in plain terms
Sharing options: publish as a public link or export as PDF or CSV. Clients can review without needing a Planable account.
Built for teams managing multiple clients or brands
Planable Analytics is structured around workspaces, so each client or brand has its own analytics environment. That keeps data separated and reports client-specific, reducing the risk of cross-client mix-ups.
This matters most when you’re reporting across many accounts, every month, and want consistent outputs without manual spreadsheets.
Planable Analytics by platform
Facebook Analytics
See Page performance in one place: reach, impressions, engagement, reactions, and clicks. Identify top posts by reach or engagement and drill into individual posts for detail.
Instagram Analytics
Track reach, views, follower growth, and engagement across posts. Sort the content view by metrics like saves, shares, comments, and reach to see what’s resonating.
LinkedIn Analytics
Track performance for company pages and personal profiles. For personal profiles, analytics covers only content published through Planable. Review impressions, reach, engagement, follower growth, click-through rate, and content comparisons by format/topic.
LinkedIn audience insights add context for B2B reporting: follower location, industry, career level, and seniority.
TikTok Analytics
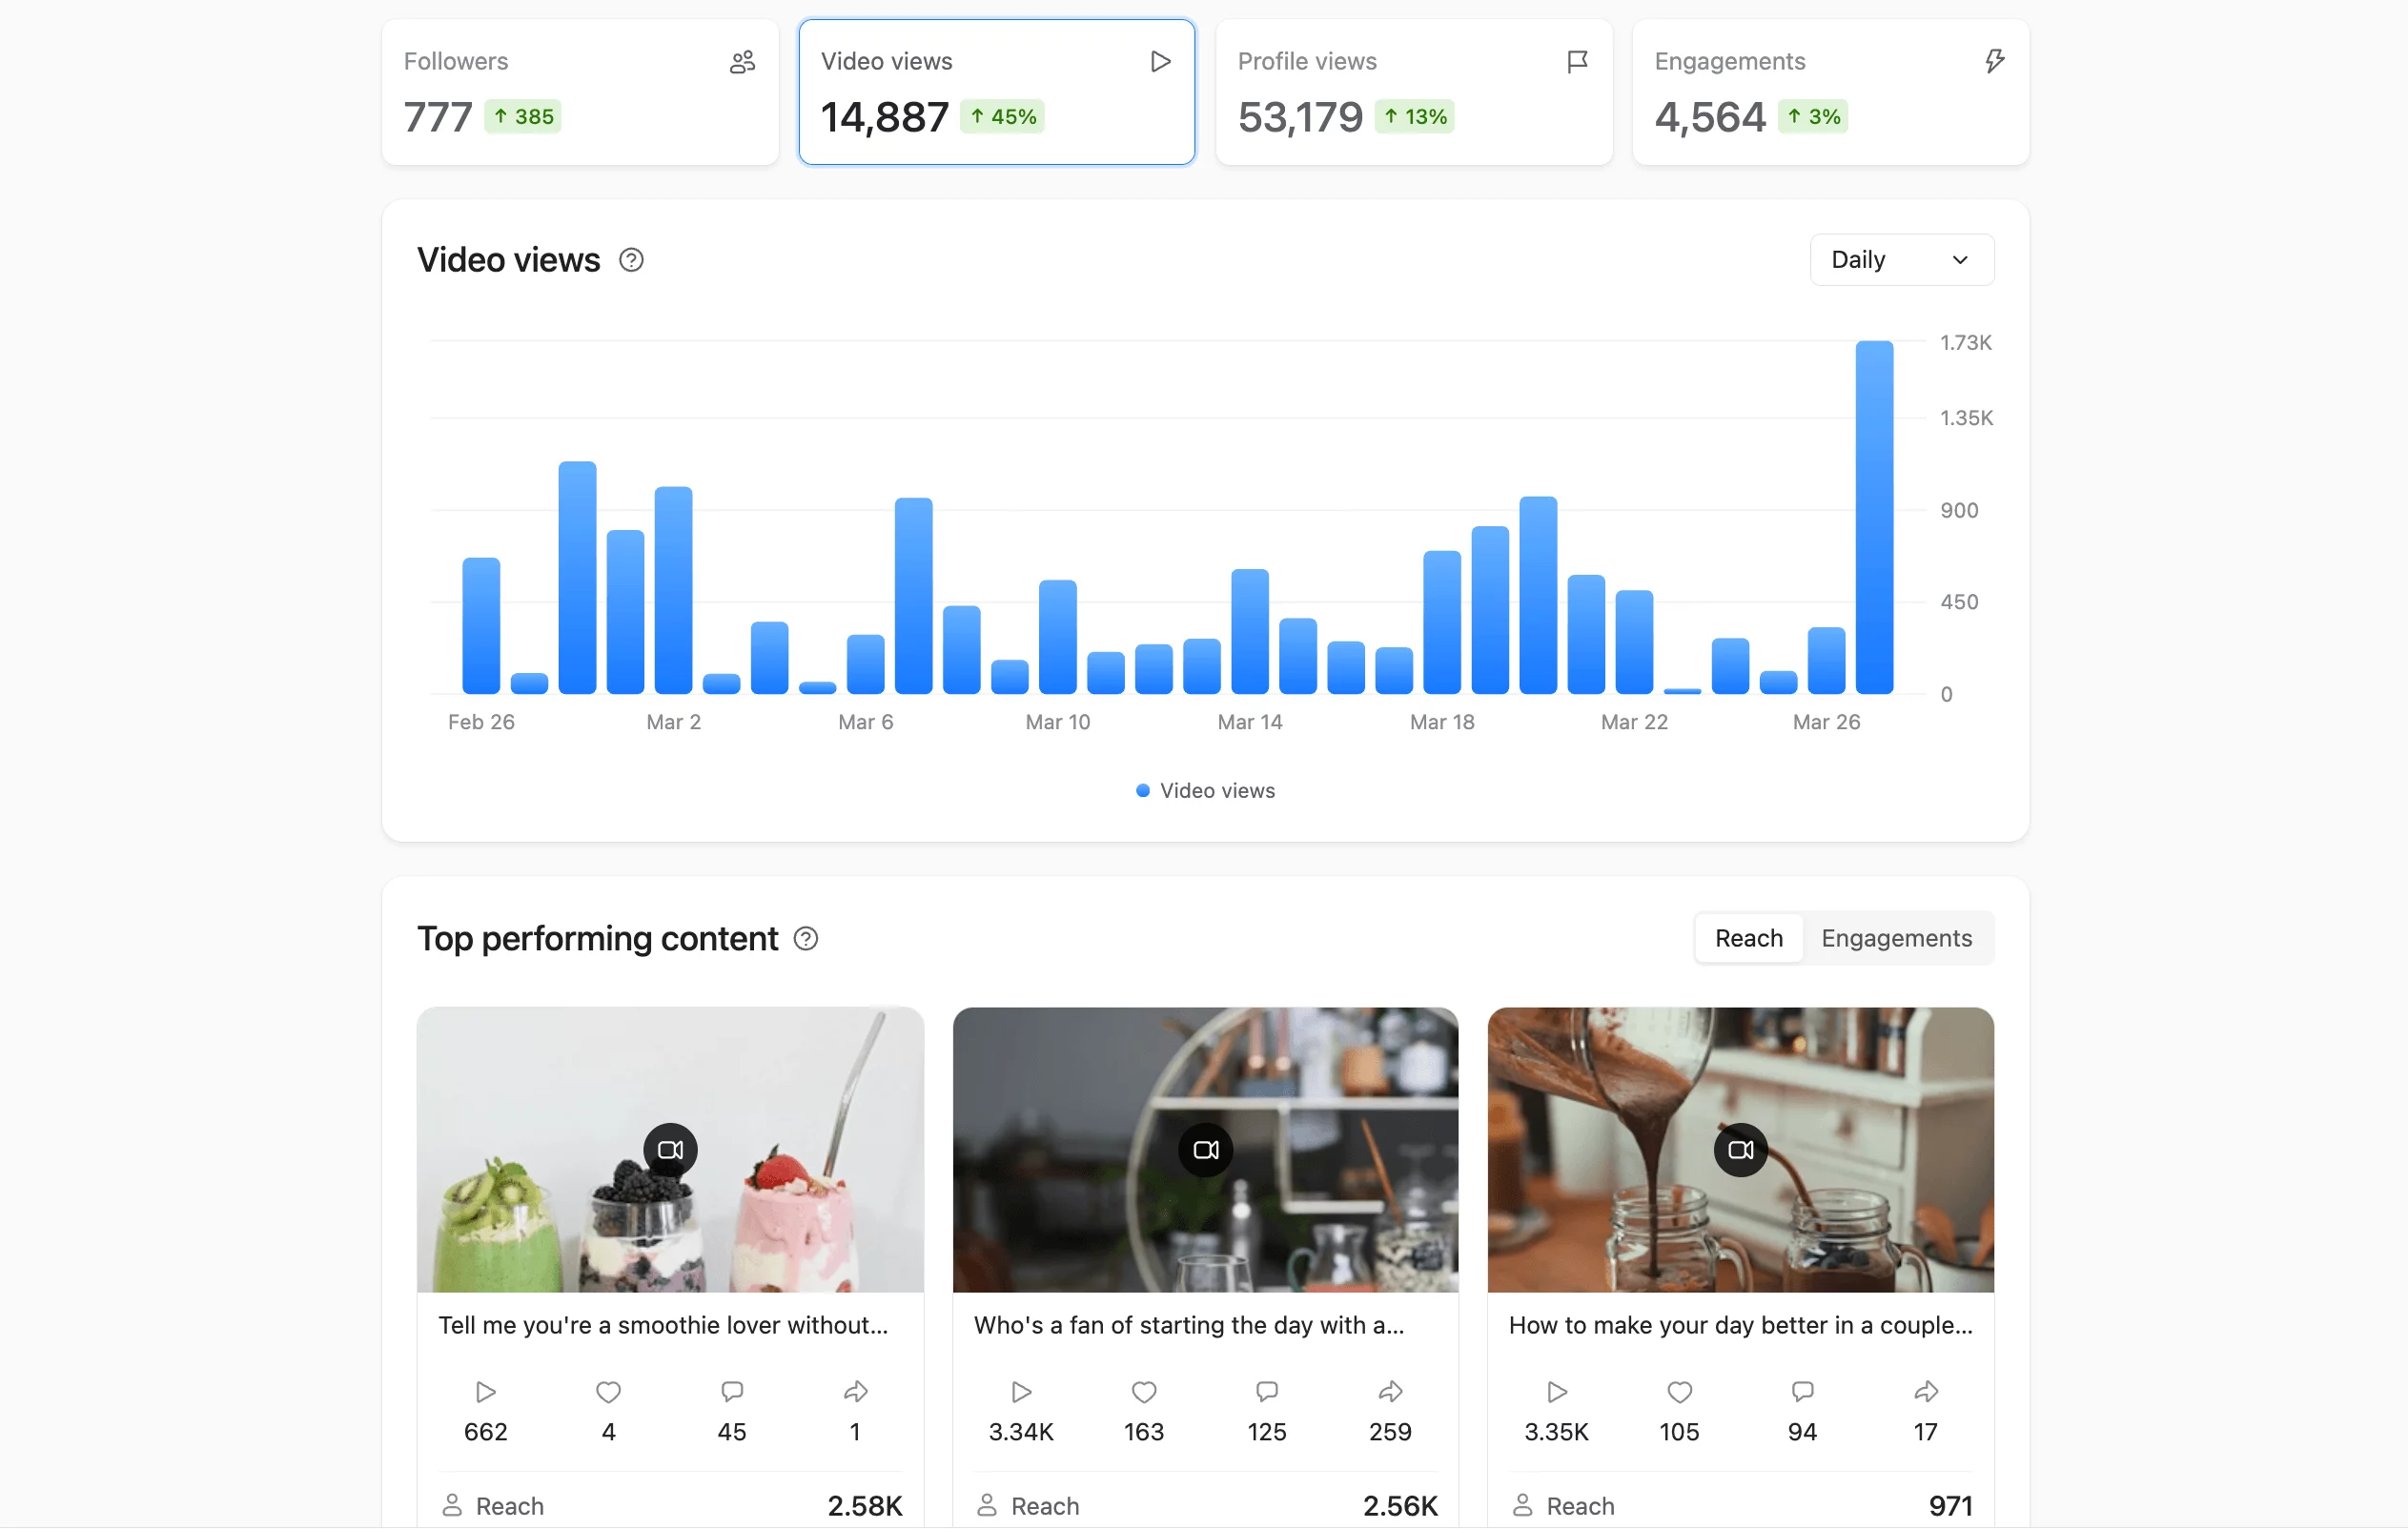
TikTok analytics dashboard in Planable
Monitor follower trends, video views, profile views, and engagement. Quickly see top-performing content by reach or engagement, and open any post for a detailed breakdown.
Learn who your followers are based on geographic and gender distribution.
YouTube Analytics
Track views, watch time, subscriber changes, and engagement at both channel and per-video levels. Review top videos and compare all content in a table-style list with metrics by column.
Deeper context includes viewer geographies, age and gender distribution, and watch time by subscriber status.
Google Business Profile Analytics
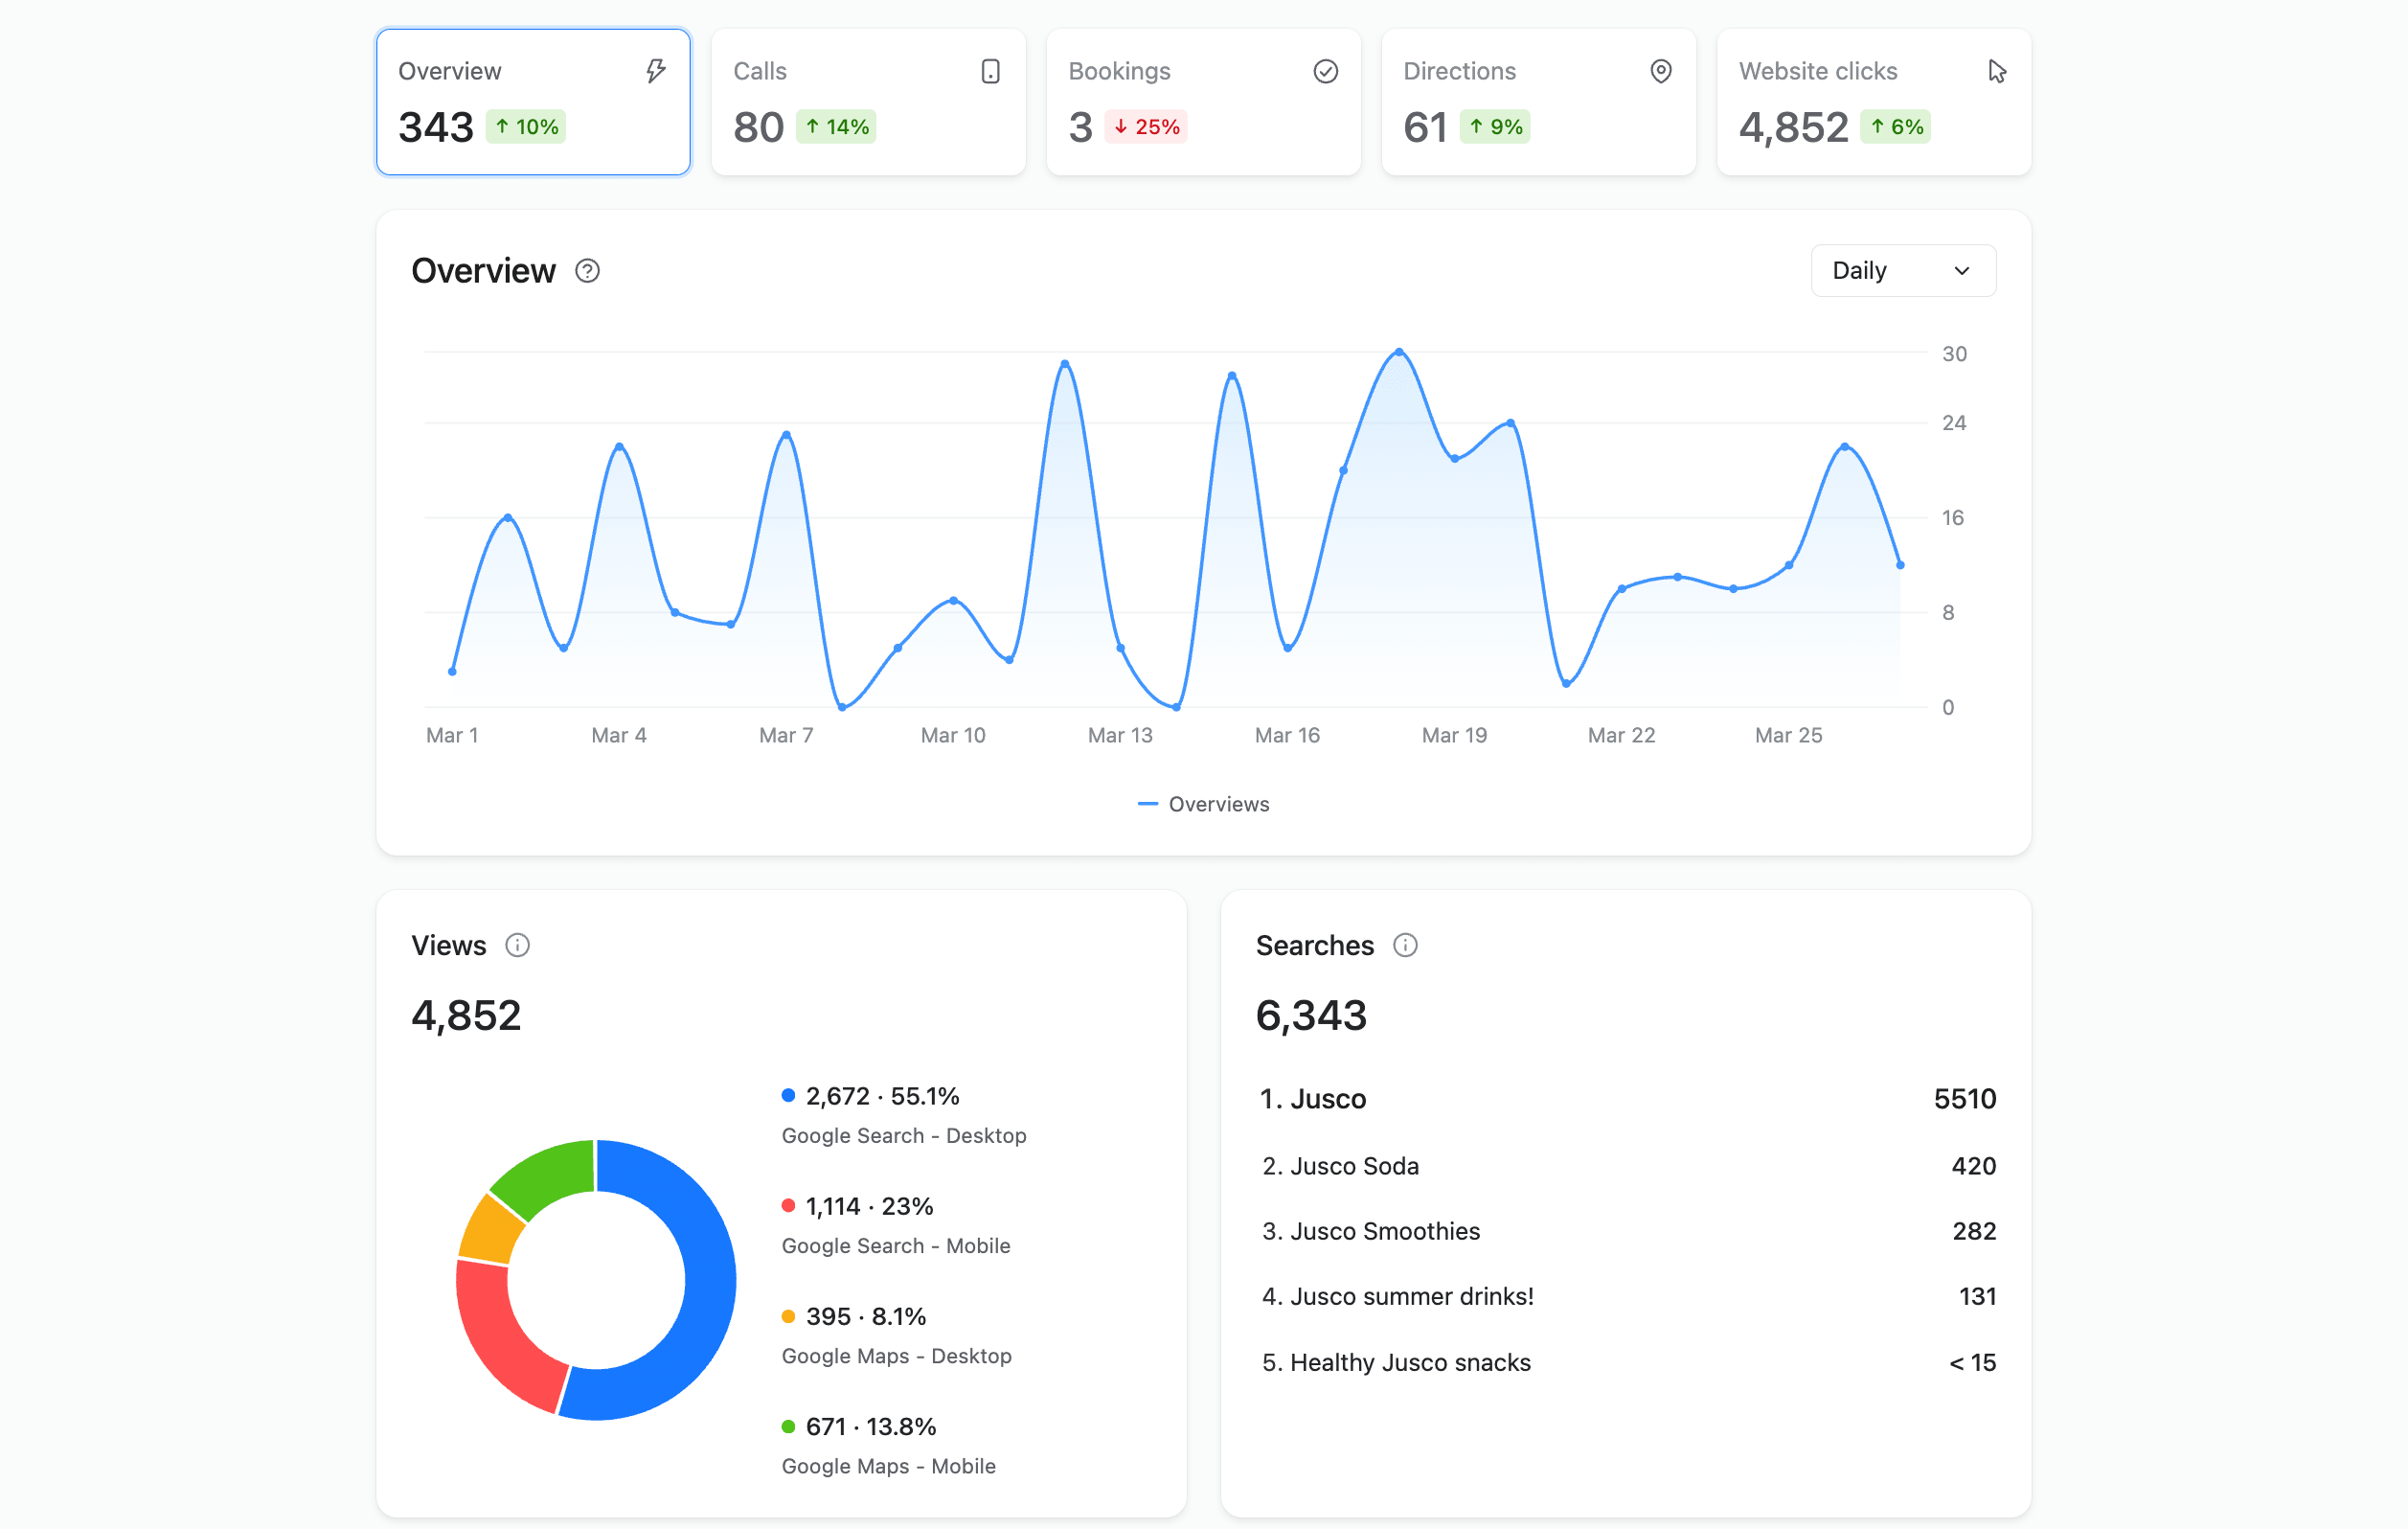
Google Business stats in Planable showing views, searches, and traffic sources
Measure performance on Google Search and Maps: calls, bookings, direction requests, website clicks, plus the searches and views that drove actions.
Pricing
Planable Analytics is a paid add-on billed separately from your Planable subscription.
$14 per workspace per month
$140 per workspace per year
Who Planable Analytics is a good fit for
Agencies producing recurring client reports across multiple brands
Social teams managing several platforms and wanting one consistent view
Teams that need to tie results back to individual posts and campaigns
Anyone who wants faster reporting with room for explanation and narrative
When it might not be the best fit
Teams that only need a single platform’s native analytics and don’t report cross-channel
Anyone who expects every metric to match each platform’s dashboard exactly (minor differences can occur, such as reach calculations on Instagram)
FAQs
What does Planable Analytics do?
Planable Analytics brings social media performance data into your Planable workspace so you can track results, identify top-performing content, understand your audience, and build client-ready reports in the same tool where you plan and publish.
Which platforms does it cover?
Facebook, Instagram, LinkedIn, TikTok, YouTube, and Google Business Profile.
Do I need to connect each social account separately?
Yes. You connect each account to Planable and analytics data flows in automatically. Historical data availability varies by platform.
Can I create reports that combine data from multiple platforms?
Yes. Cross-channel reports support Instagram, Facebook, LinkedIn, TikTok, and YouTube. Google Business Profile is available in single-channel reports.
Can I share reports with clients who don’t use Planable?
Yes. Reports can be shared via a public link or exported as PDF or CSV. No Planable account is required to view them.
Can I add commentary or context to reports?
Yes. Each report section supports custom notes so you can explain results in plain language.
What are audience insights?
Audience insights show follower demographics: location, age, and gender. Available for Instagram, LinkedIn, and TikTok. LinkedIn also includes industry, career level, and seniority.
Is Analytics included in my Planable subscription?
No. It’s a paid add-on priced per workspace.
Does analytics data connect to campaigns?
Yes. If you use campaigns in Planable, performance data for posts within a campaign is accessible inside that campaign, so results stay connected to the content.
Monica leads product marketing at Planable. She owns go-to-market for new features and shapes how Planable fits into the broader SE Ranking product family. She joined in 2023 as Planable's first product marketer, built the function from scratch, and now runs the team's competitive intelligence program. With a background in product management and Romania's startup scene (How To Web, MVP Academy), she writes about competitor analysis, product launches and marketing workflows from the builder's side. Before Planable, she spent almost five years managing Orange Fab Romania, Orange's startup acceleration program, where she supported 40 startups and helped generate over €2.2M in commercial value.







 Creation
 Scheduling
 Planning
 Social Inbox
 Collaboration
 Analytics
 Approval
 Social Listening