If your Instagram keeps disconnecting, your scheduler swallows the post and silently fails, your support ticket has been “with the team” for a week, or your monthly bill creeps up every time you add a channel, you’re not the only one running out of patience with...
Redesign For multi-location brands
all your locations, one content flow
For multi-brand companies
content collaboration at scale
For agencies
impress your clients and take on more
“The team loved it from the start. Planable helps us overview the entire marketing efforts.“
If you manage social media for multiple clients or brands, competitor reporting can quickly become repetitive. A client asks, “How are we doing against this competitor?” and the answer often depends on manual checks: opening profiles, counting followers, reviewing recent posts, taking screenshots, and copying numbers into a report.
That process works for a one-off check, but it does not scale. When you monitor several clients, multiple competitors, and monthly reporting cycles, manual competitor analysis can take hours and still leave gaps.
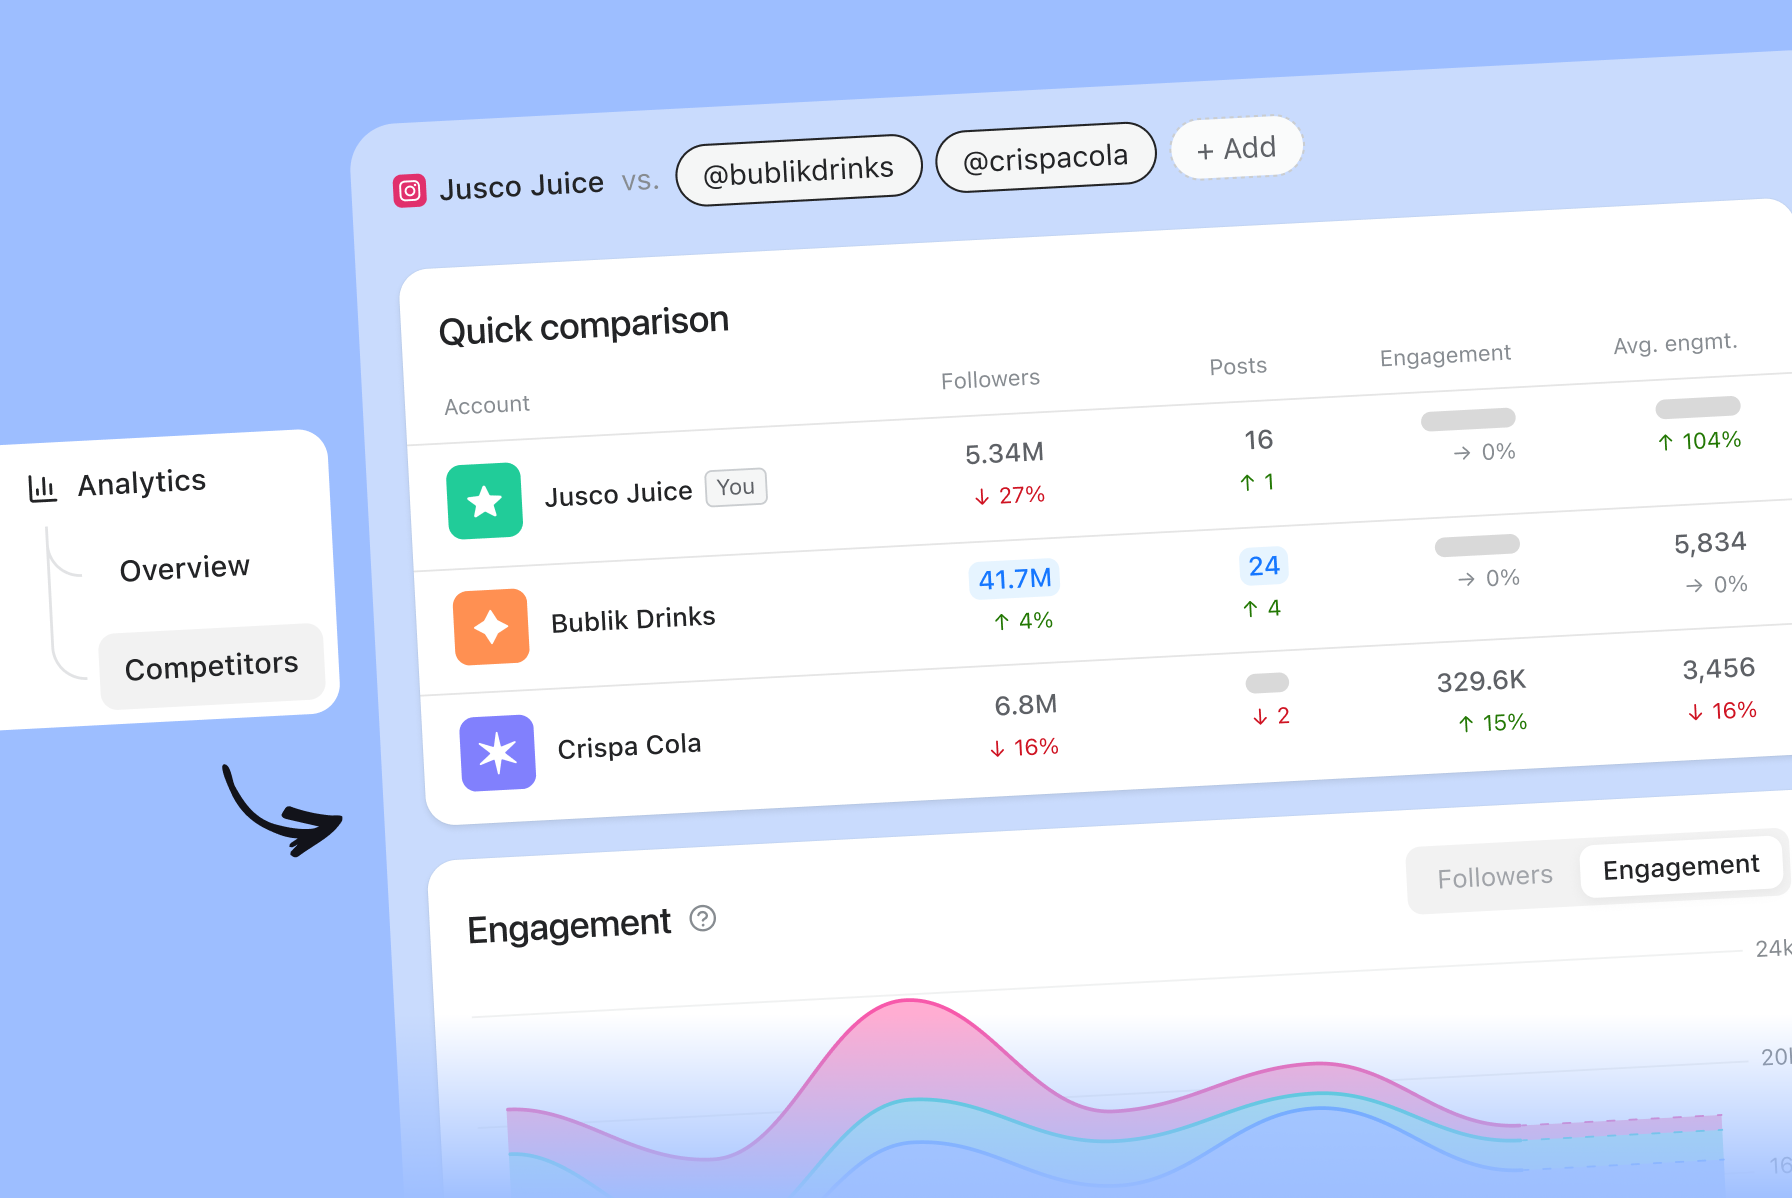
Planable’s Competitor Analytics tab gives social media teams and agencies a structured way to compare competitor performance. You add a competitor’s social handle once, and Planable tracks that page alongside your own analytics. The comparison table updates daily, so teams can review competitor movement without rebuilding spreadsheets or collecting screenshots by hand.
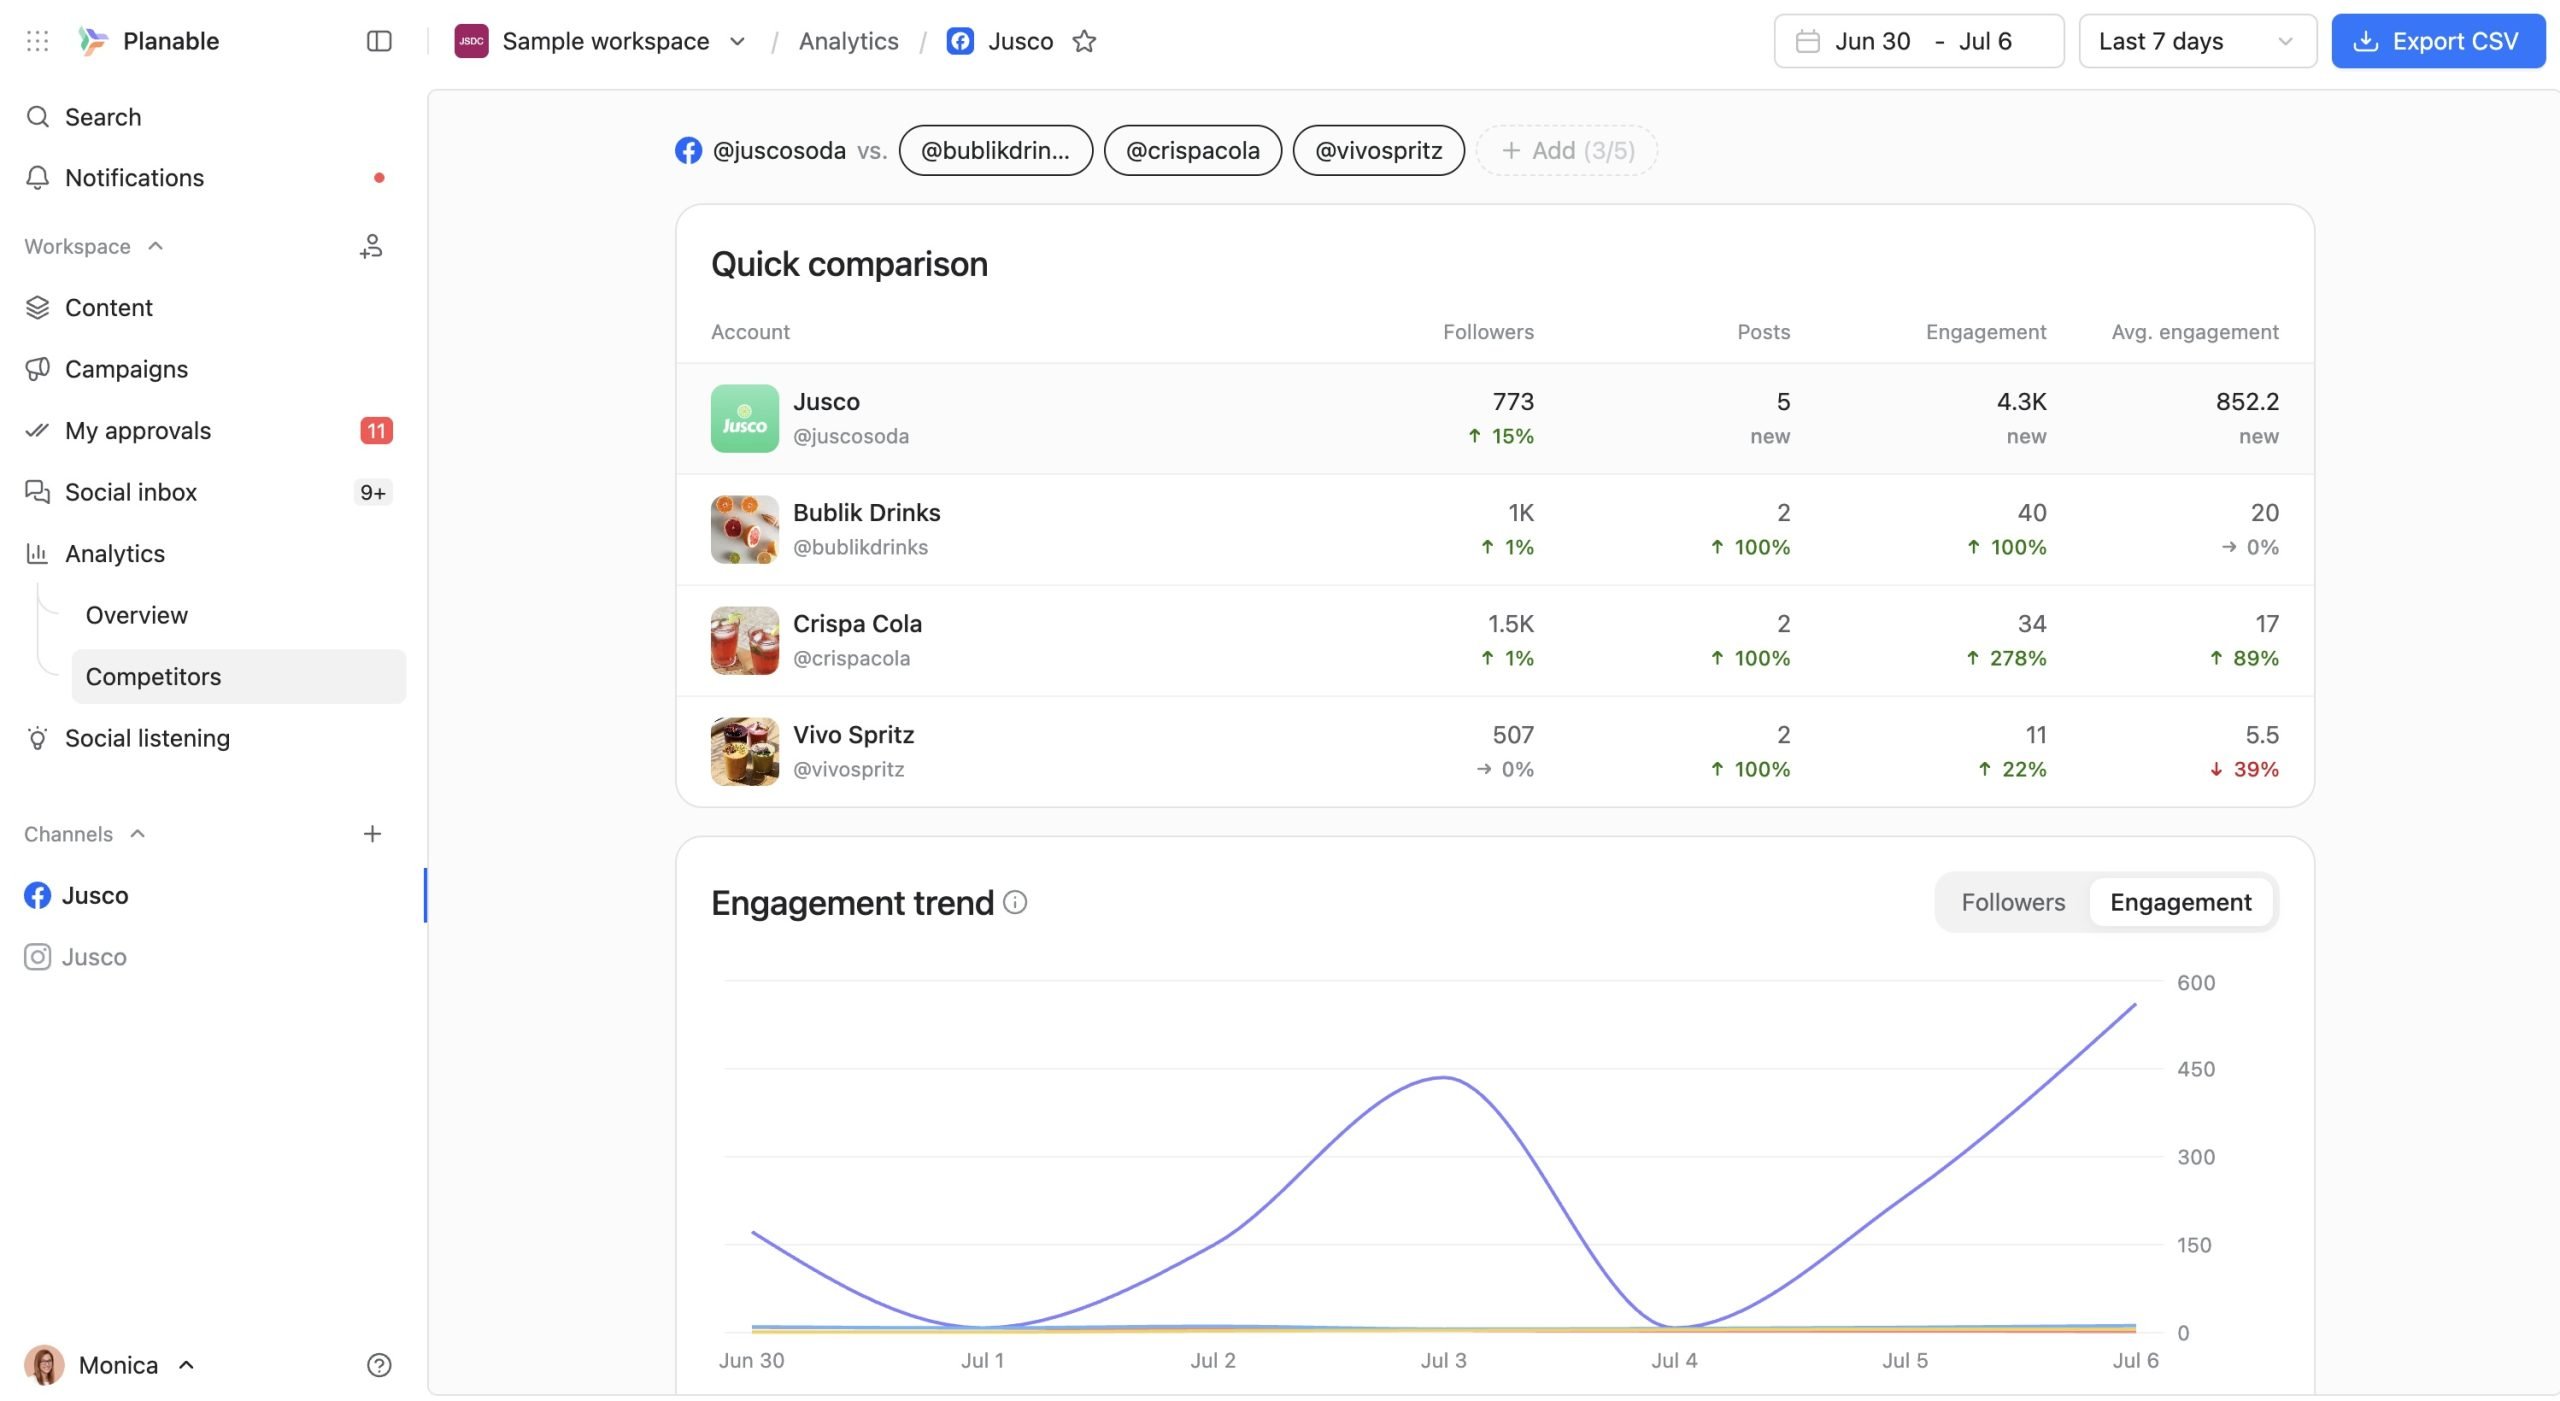
Planable competitor analytics dashboard
This guide covers what the feature does, how it works day to day, how to set it up, where it fits inside Planable’s broader Analytics section, and who it’s built for.
What competitor analytics does
Competitor Analytics is a tab inside Planable Analytics that lets you track up to five competitors’ social profiles per page and see them measured against your own: same metrics, same time window, same view. It works with the networks listed under Supported platforms below, and that list keeps growing.
Instead of jumping between your dashboard and a competitor’s public profile, you get one screen: your page’s followers, posts, and average engagement lined up next to theirs, with the change over time already calculated.
It’s the same kind of benchmarking an agency might charge extra for, built into the tool you’re already scheduling posts from.
Supported platforms
Currently supported:
Instagram
Facebook
LinkedIn
TikTok
YouTube
How it works in practice
Once you’ve added competitors to a page, the Competitors tab gives you four things:
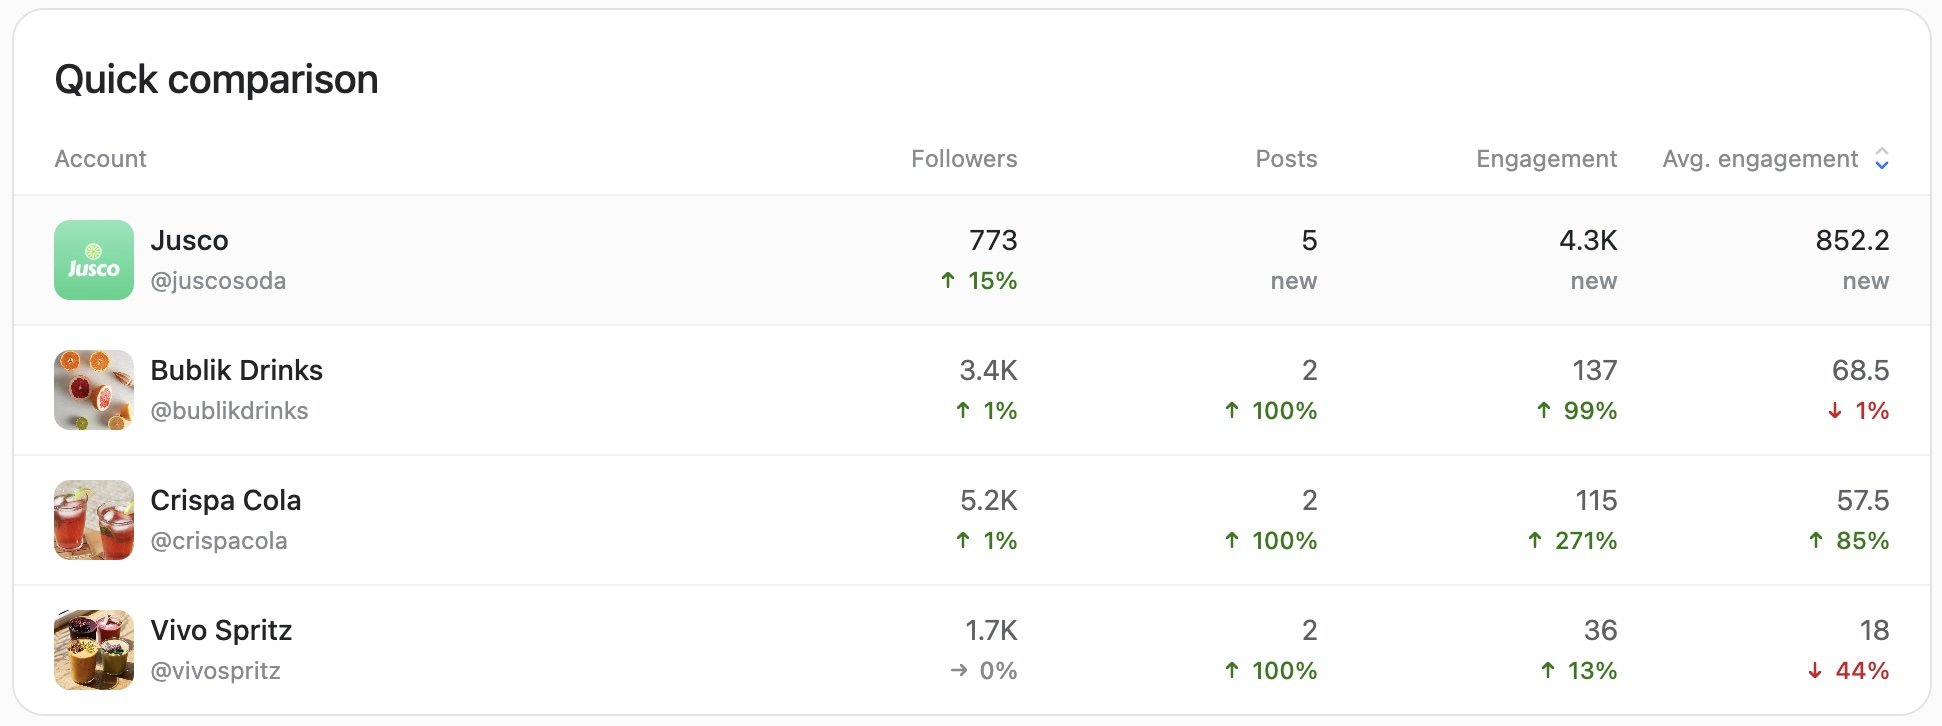
A comparison table. Your page vs. each tracked competitor, across followers, posts, and average engagement. It respects whatever date range you’ve picked and shows period-over-period deltas — so you can see who gained or lost ground, not just where things stand today.
Planable competitor comparison table
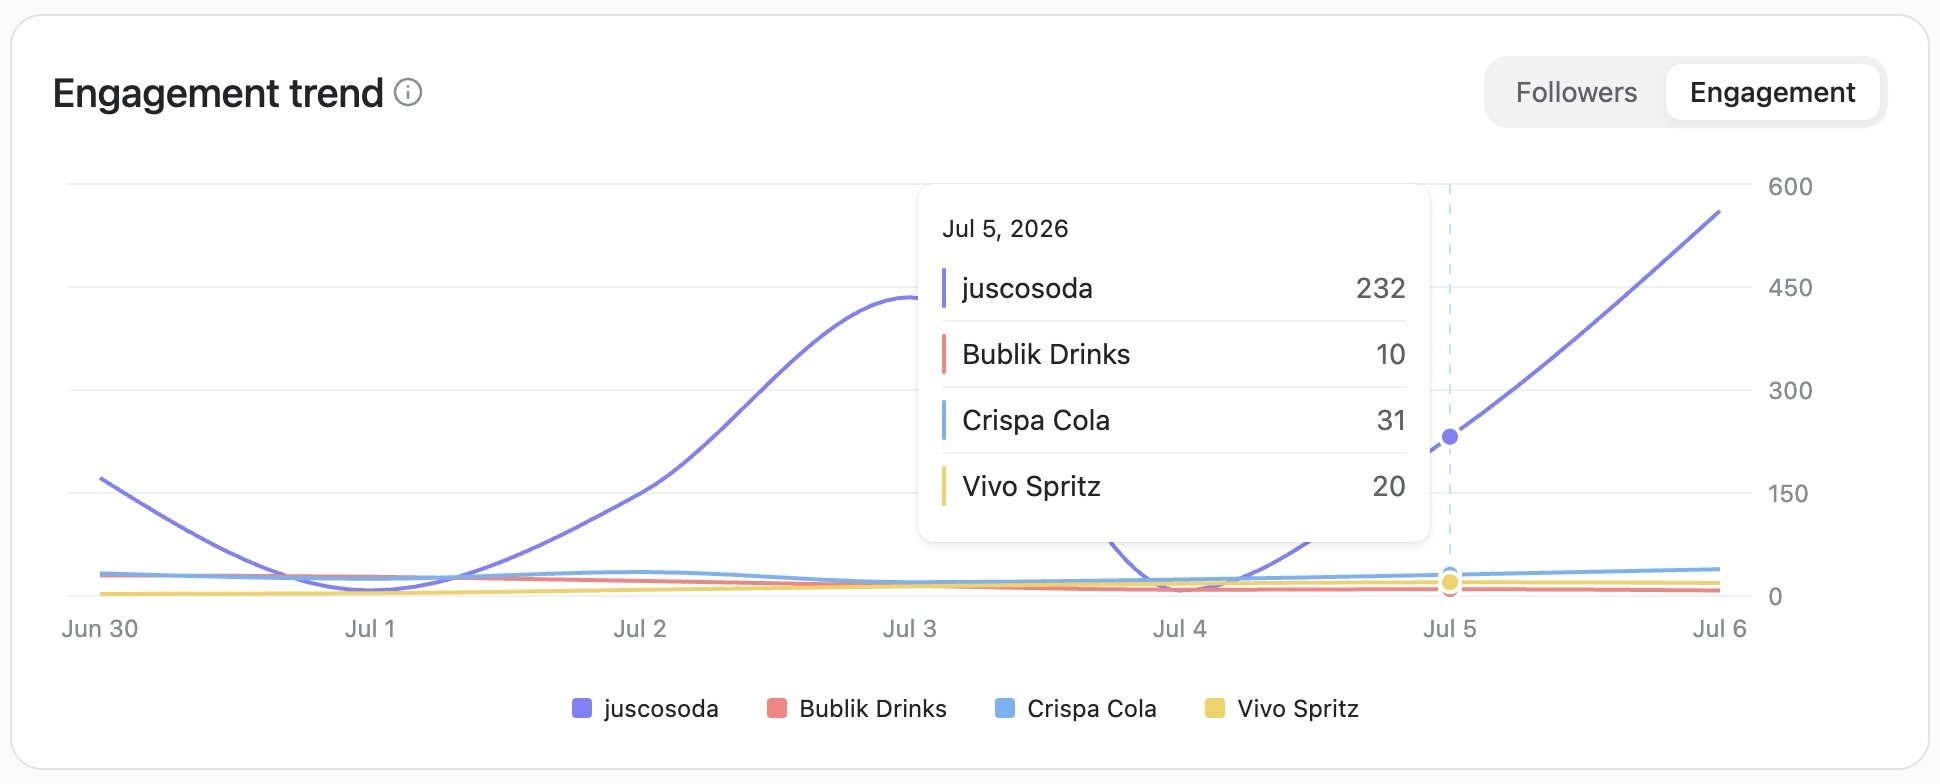
A metric trend chart. Followers and engagement plotted over time, your page against every competitor you’re tracking, so you can spot when someone’s growth curve bends.
Planable engagement trend chart
Top competitor posts. The best-performing recent posts from each competitor, with their engagement numbers attached — useful when a client asks “what’s working for them right now?”
Planable top competitor content grid
CSV export. Pull the raw numbers into whatever report or deck you’re already building.
The data comes from public profile data, the same information anyone could see by visiting the profile directly. Instagram and Facebook figures come through Meta’s public Graph API. YouTube, TikTok and LinkedIn use their own sourcing, which is why the metrics available can differ slightly by network. Competitors have no way of knowing you’re tracking them.
Numbers refresh once a day, around 4am UTC, and trend charts need at least two days of snapshots before they’re useful. So add competitors a couple of days before you need the comparison, not the morning of.
If a profile fails to sync three times in a row, Planable marks it as unavailable rather than showing you stale numbers.
Setting it up
Go to Analytics in the left sidebar, then open the Competitors tab.
Make sure the page you want to benchmark is on one of the supported platforms (see Supported platforms above).
Click + Add. You’ll either see a list of suggested competitors Planable has already put together for that page, or you can search by handle or name, or paste the competitor’s profile URL.
Planable runs an initial sync within about a minute, pulling their profile, recent posts, and a first follower snapshot.
Repeat for up to five competitors per page.
Give it two days, then check the comparison table and trend chart; that’s when the period-over-period numbers start meaning something.
Adding or removing a competitor requires Owner, Admin, or Editor access. Anyone with Analytics access on the workspace can view the tab once it’s set up.
Let Planable suggest the competitors
If you don’t already have a list of handles ready, you don’t have to start from a blank field. Planable can suggest up to five competitors for the page you’re viewing, so the tab is useful the first time you open it rather than after an afternoon of research.
The suggestions are built from that page’s own public profile:
its display name and handle
its bio or description
its category and location, on Facebook and YouTube
Planable uses that to find accounts operating in the same space on the same network, then narrows the list to five real businesses. Fan pages, news pages, review pages and accounts in the wrong geography get filtered out.
Two details matter in practice. The suggestions are scoped to the one connected page you’re viewing, not your whole workspace, so a multi-brand workspace gets a different list per page. And the list is generated once per page and then cached, so it won’t reshuffle every time you open the tab. Add the ones that fit, ignore the rest, and mix in your own handles, up to five per page.
Where this fits inside Planable Analytics
Competitor Analytics is one tab inside a larger Analytics section, and it’s worth knowing what’s around it — because the same date range and page selection you use for competitor comparisons carries over to the rest of your reporting.
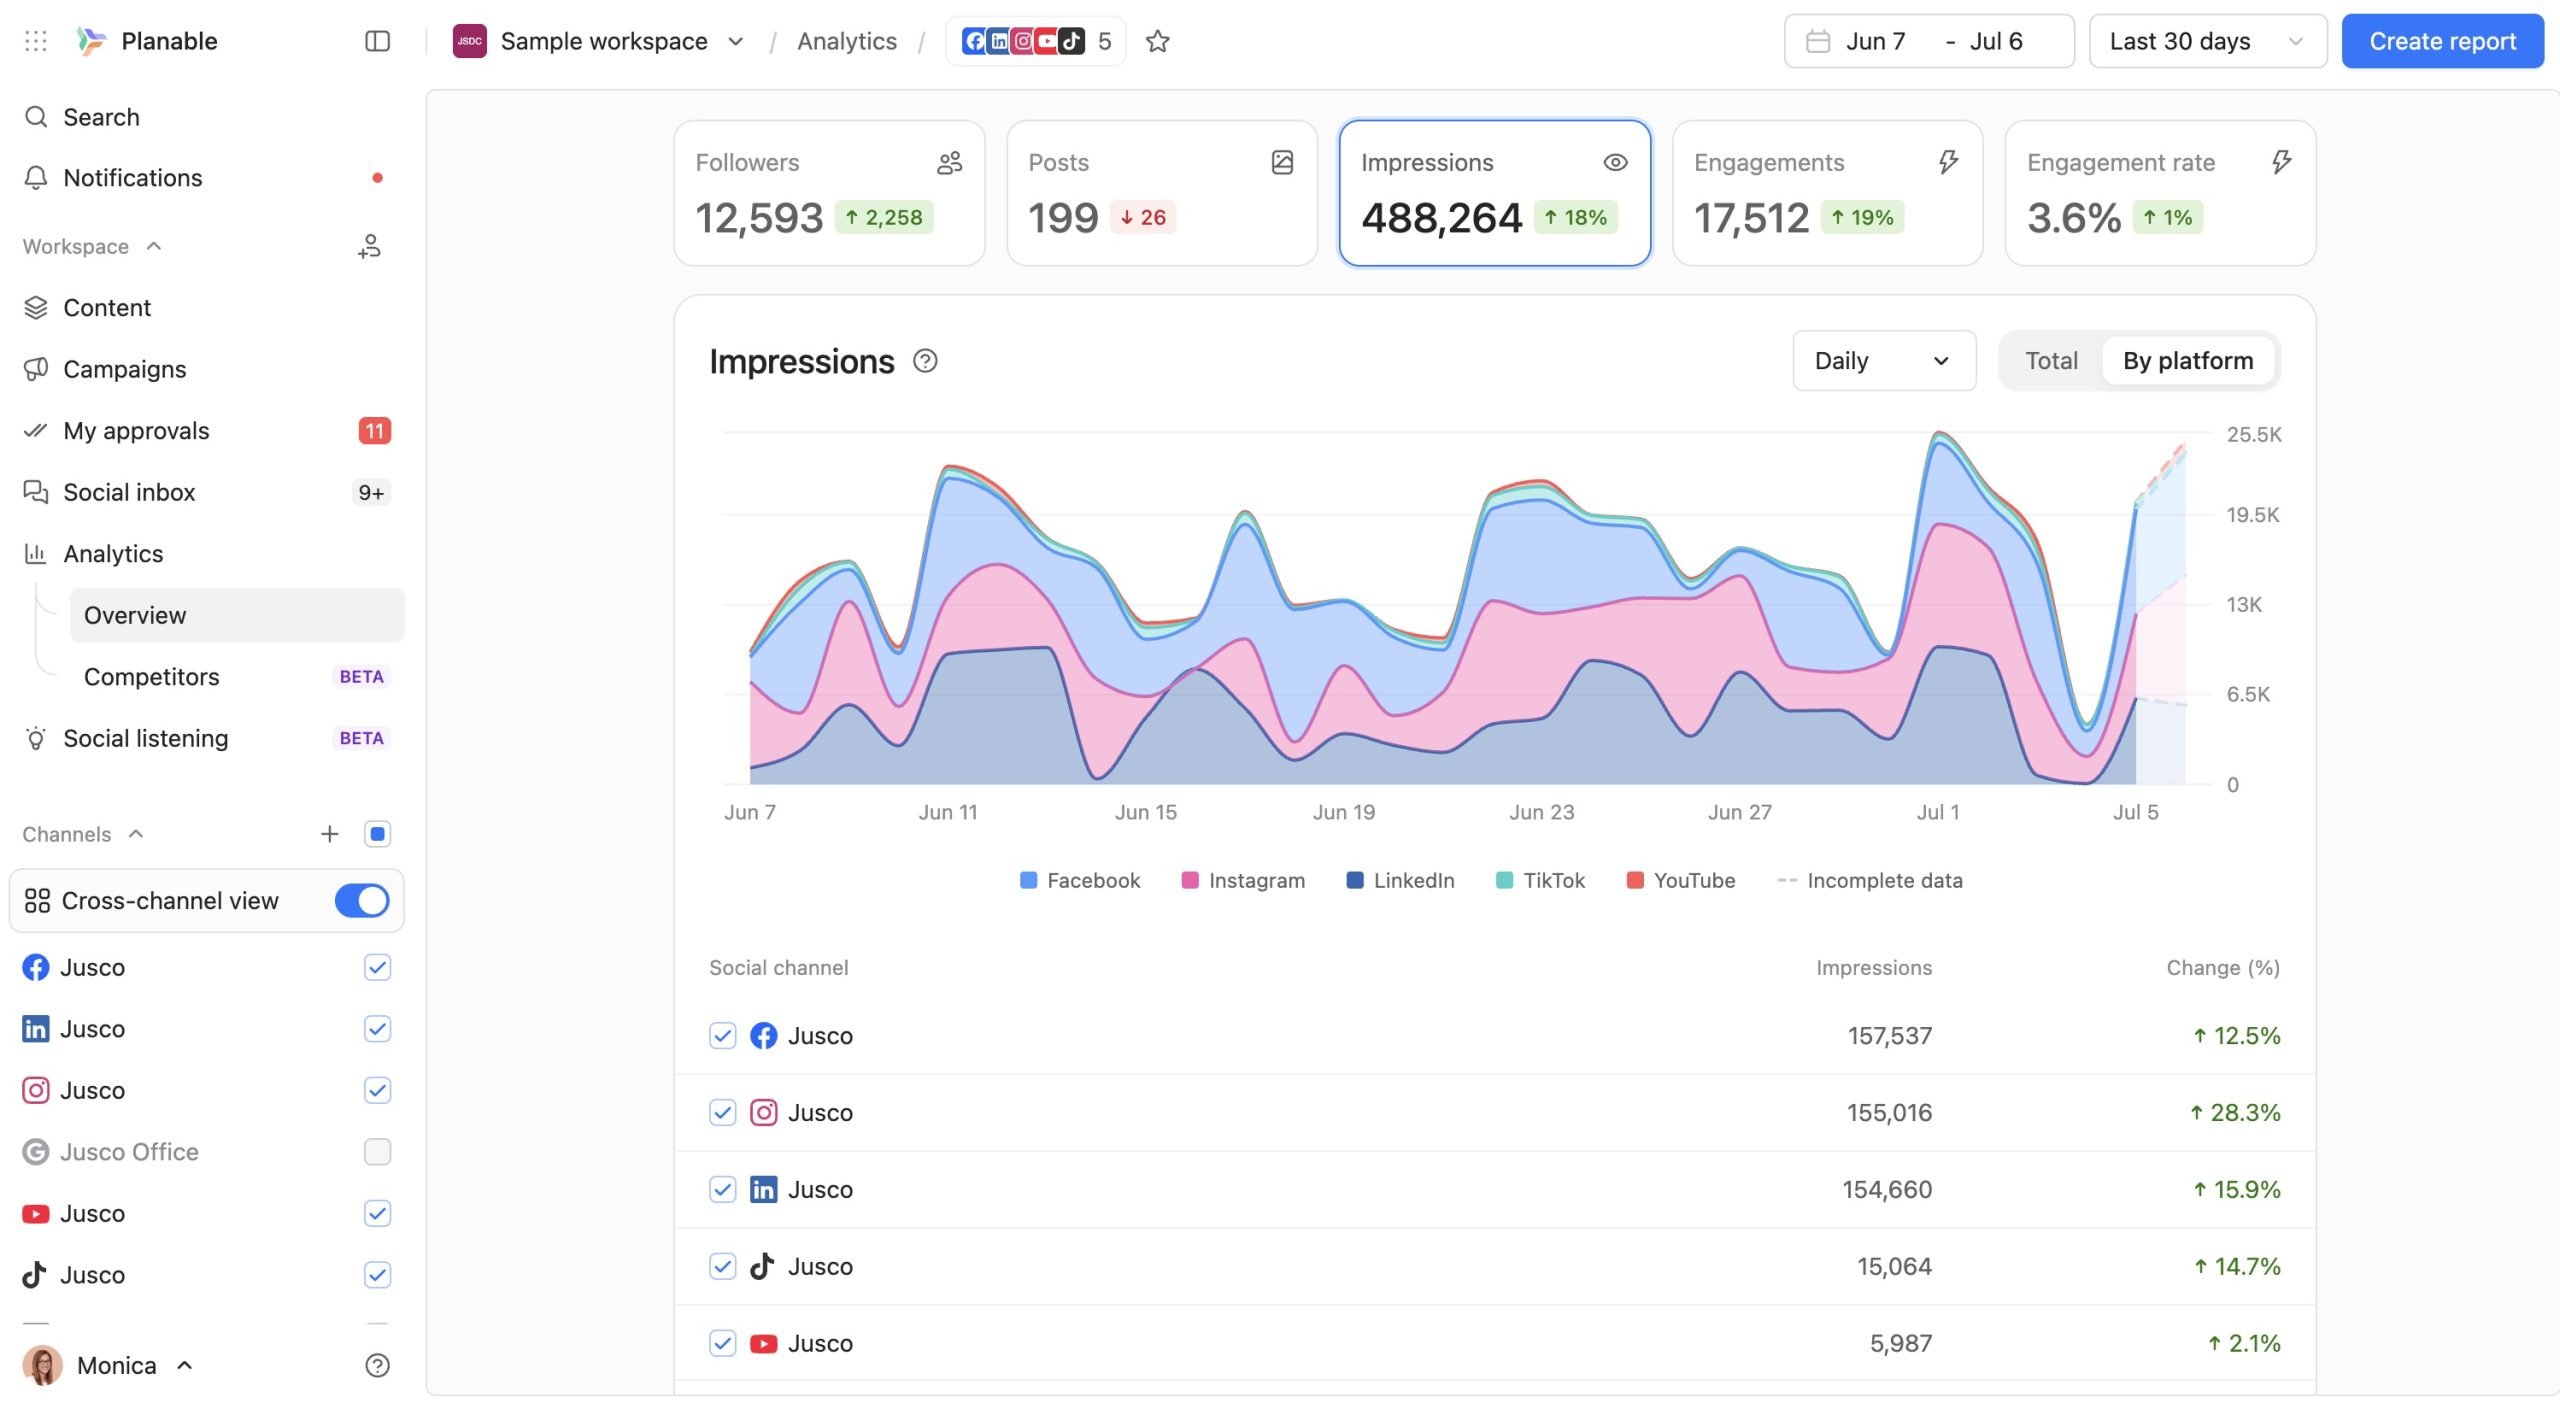
Planable cross-channel analytics dashboard
Planable Analytics covers three views:
Per-page analytics. Pick a single connected page and see followers, posts, views, engagements, and page views (availability depends on the platform), plus a daily follower growth chart, a top-performing-content view you can toggle between impressions and engagements, and a content table with a full breakdown: impressions, engagement, plays, reactions, comments, shares. You can filter by post type: All, Posts, Reels, or Stories, depending on the platform.
Cross-channel analytics. Flip the “Cross-channel view” toggle and Planable aggregates every connected page into one view: total followers, posts, impressions, engagements, and engagement rate, with a per-platform breakdown table showing change and growth rate. Charts cover follower growth, published content volume, reach and visibility trends, audience interactions, and engagement quality, plus your most viewed and most engaging posts across every channel at once.
Customizable reports. Click “Create report” to build a client-ready report from scratch: drag and drop sections, add your own titles and descriptions, upload your company logo, pick a date range, then share it as a public link, a PDF, or a CSV.
Planable cross-channel report builder
Analytics supports Facebook, Instagram, LinkedIn, TikTok, YouTube, Pinterest, and X/Twitter, though which specific metrics are available depends on what each platform’s API exposes. Competitor Analytics covers a smaller set of platforms by design (Youtube, TikTok, Linkedin, Facebook, and Instagram), but it lives in the same place, uses the same date-range picker, and is meant to be checked in the same sitting as the rest of your numbers.
Plan availability
Analytics as a whole (including the Competitors tab) is a paid add-on: $14/workspace/month or $140/workspace/year.
If Analytics is already active on a workspace, the Competitors tab is there, waiting. If it isn’t, you’ll need to turn on the add-on first. Planable offers a 30-day free trial of Analytics for new users. Check the pricing page for more details.
Who this is for
Planable Competitor Analytics is built for social media teams and agencies that need recurring competitor reports and clear performance comparisons.
It is especially useful for:
Social media managers handling several brands or pages.
Agencies managing multiple client accounts.
Marketing teams that need to benchmark performance against competitors.
Client-facing teams preparing monthly or quarterly reports.
Teams that want to reduce manual reporting work.
It is less useful for one-time competitor research where you only need a quick manual check. The feature is strongest when competitor monitoring is repeated regularly and consistency matters.
FAQs
What does Planable Competitor Analytics do?
Planable Competitor Analytics lets social media teams add competitor handles and track those pages in a comparison table next to their own analytics.
Which platforms does Competitor Analytics support?
Facebook, Instagram, LinkedIn, TikTok, and YouTube.
How many competitors can I track?
Up to five per page.
Do I need the Analytics add-on to use this?
Yes. Competitor Analytics is a tab inside Analytics, so the add-on needs to be active on the workspace first.
Will the competitor know I’m tracking their profile?
No. Planable only reads public profile data, the same information visible to anyone who opens the profile. Instagram and Facebook come through Meta’s public Graph API, and YouTube, TikTok and LinkedIn through their own public sources. No notification or signal is sent to the tracked account.
How often is competitor data updated?
Once a day, around 4am UTC. Trend charts and period-over-period comparisons need at least two days of data to show anything meaningful, so there’s a short ramp-up after adding a new competitor.
Can I export this for a client report?
Yes, there’s a CSV export built into the Competitors tab. The broader Analytics section also supports full customizable reports with PDF and CSV downloads.
Who can add or remove tracked competitors?
Owner, Admin, or Editor roles. Anyone with Analytics access can view the tab, but adding and removing competitors is restricted to those three roles.
Who should use Competitor Analytics?
Competitor Analytics is best for agencies, social media managers, and marketing teams that regularly compare brand performance against competitors.
Where is Competitor Analytics located in Planable?
Competitor Analytics is located inside Planable’s Analytics section, alongside your own page performance data.
Does Planable suggest competitors for me?
Yes. When you open the Competitors tab on a connected page, Planable can suggest up to five competitors based on that page’s own public profile, including its name, handle, bio and, on Facebook and YouTube, its category and location. It filters out your own accounts, fan and news pages, and accounts in the wrong geography. The list is generated once per page and cached, so it stays stable between visits. You can add the suggestions, ignore them, or mix them with your own handles, up to five per page.
Can I get competitor data through Claude or ChatGPT?
Yes. Planable’s MCP connector includes read-only competitor analytics: add or remove tracked competitors, compare them, see metric trends, and pull their top posts. It covers Instagram and Facebook, not yet YouTube, TikTok or LinkedIn. The connector is free on every plan, but competitor data through it needs the Analytics add-on and the same permission you would need in the app. The same capabilities are in the Public API on Pro and Enterprise plans.
Monica leads product marketing at Planable. She owns go-to-market for new features and shapes how Planable fits into the broader SE Ranking product family. She joined in 2023 as Planable's first product marketer, built the function from scratch, and now runs the team's competitive intelligence program. With a background in product management and Romania's startup scene (How To Web, MVP Academy), she writes about competitor analysis, product launches and marketing workflows from the builder's side. Before Planable, she spent almost five years managing Orange Fab Romania, Orange's startup acceleration program, where she supported 40 startups and helped generate over €2.2M in commercial value.








 Creation
 Scheduling
 Planning
 Social Inbox
 Collaboration
 Analytics
 Approval
 Social Listening