The chart dips, and many social media sentiment analysis tools stop right there: the reply happens in another inbox, and the client or location report gets rebuilt by hand somewhere else. Scoring the mood is the easy part of social media sentiment analysis. The...
Social reports that make your results impossible to question
Build client-ready reports with cross-channel performance, audience insights,
and top posts based on the metrics that matter

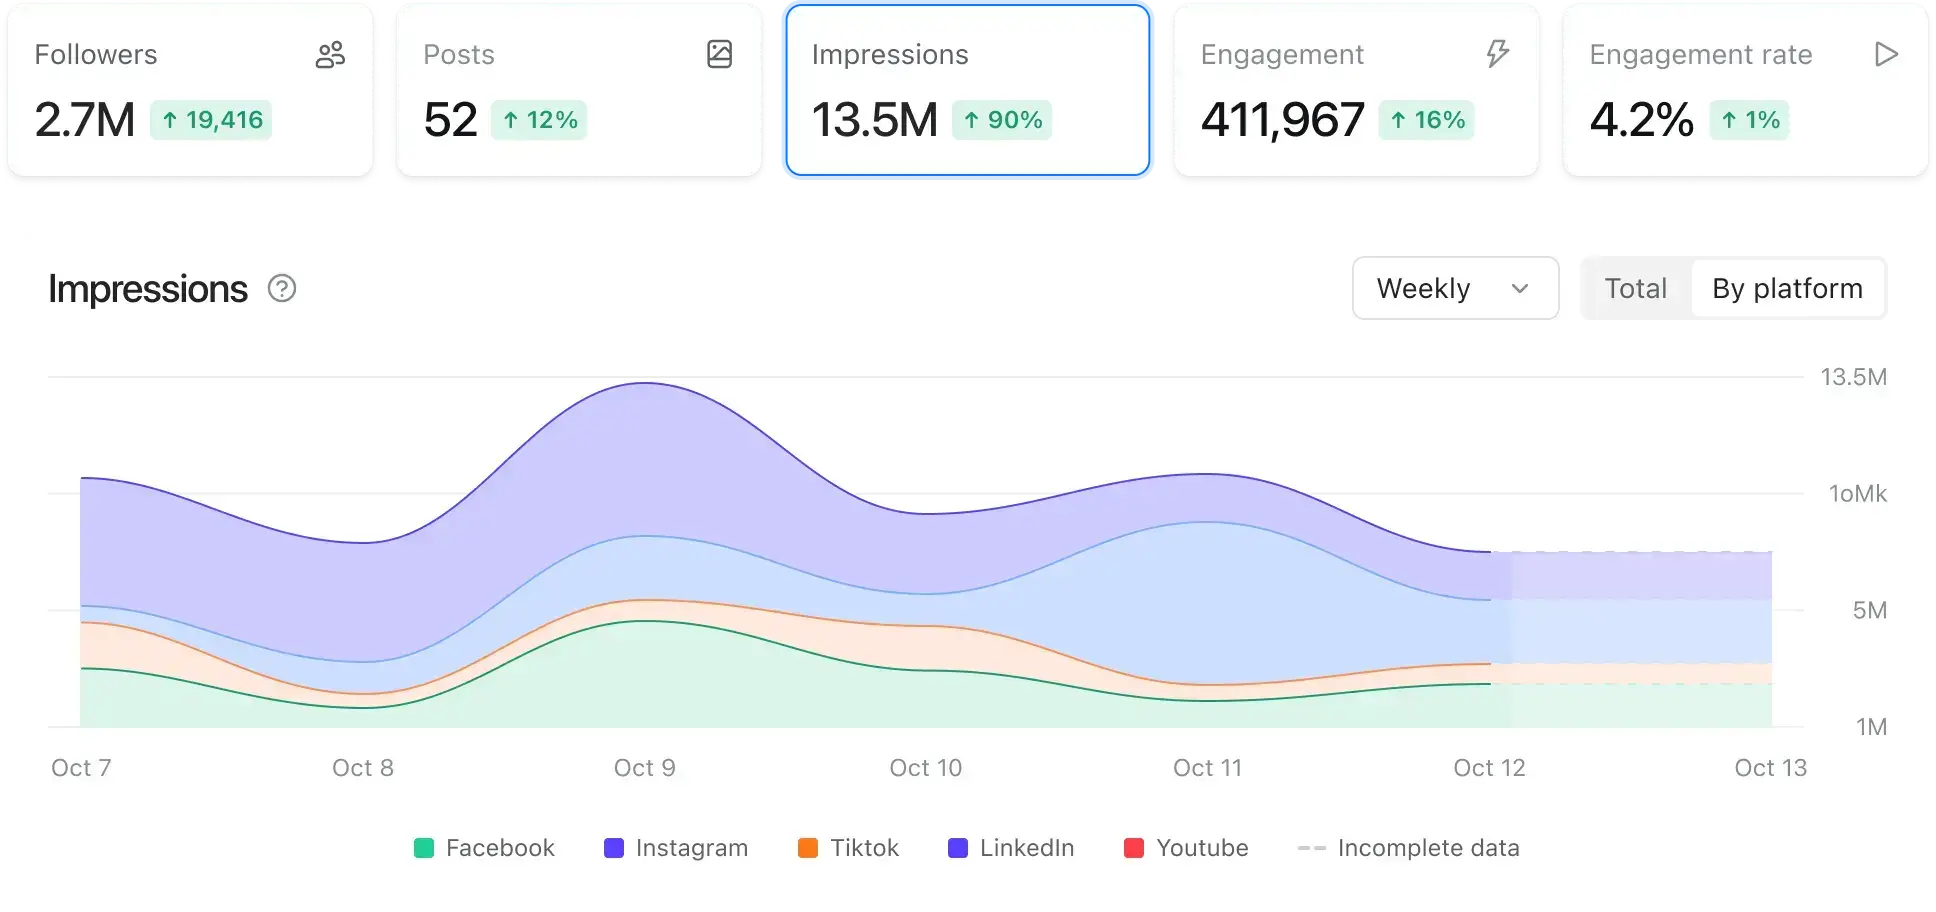
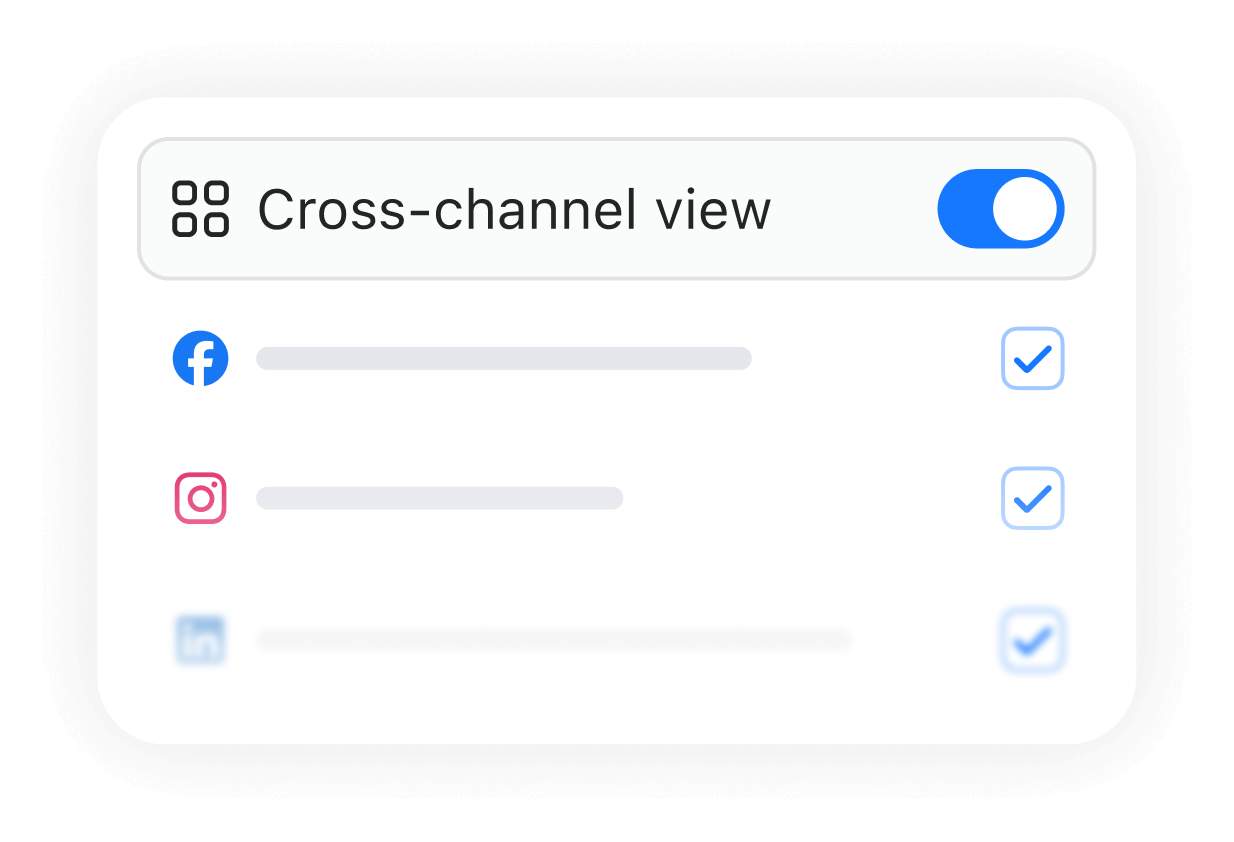
View and compare data across platforms
See all your channels in one uncluttered dashboard and easily choose which ones to compare.


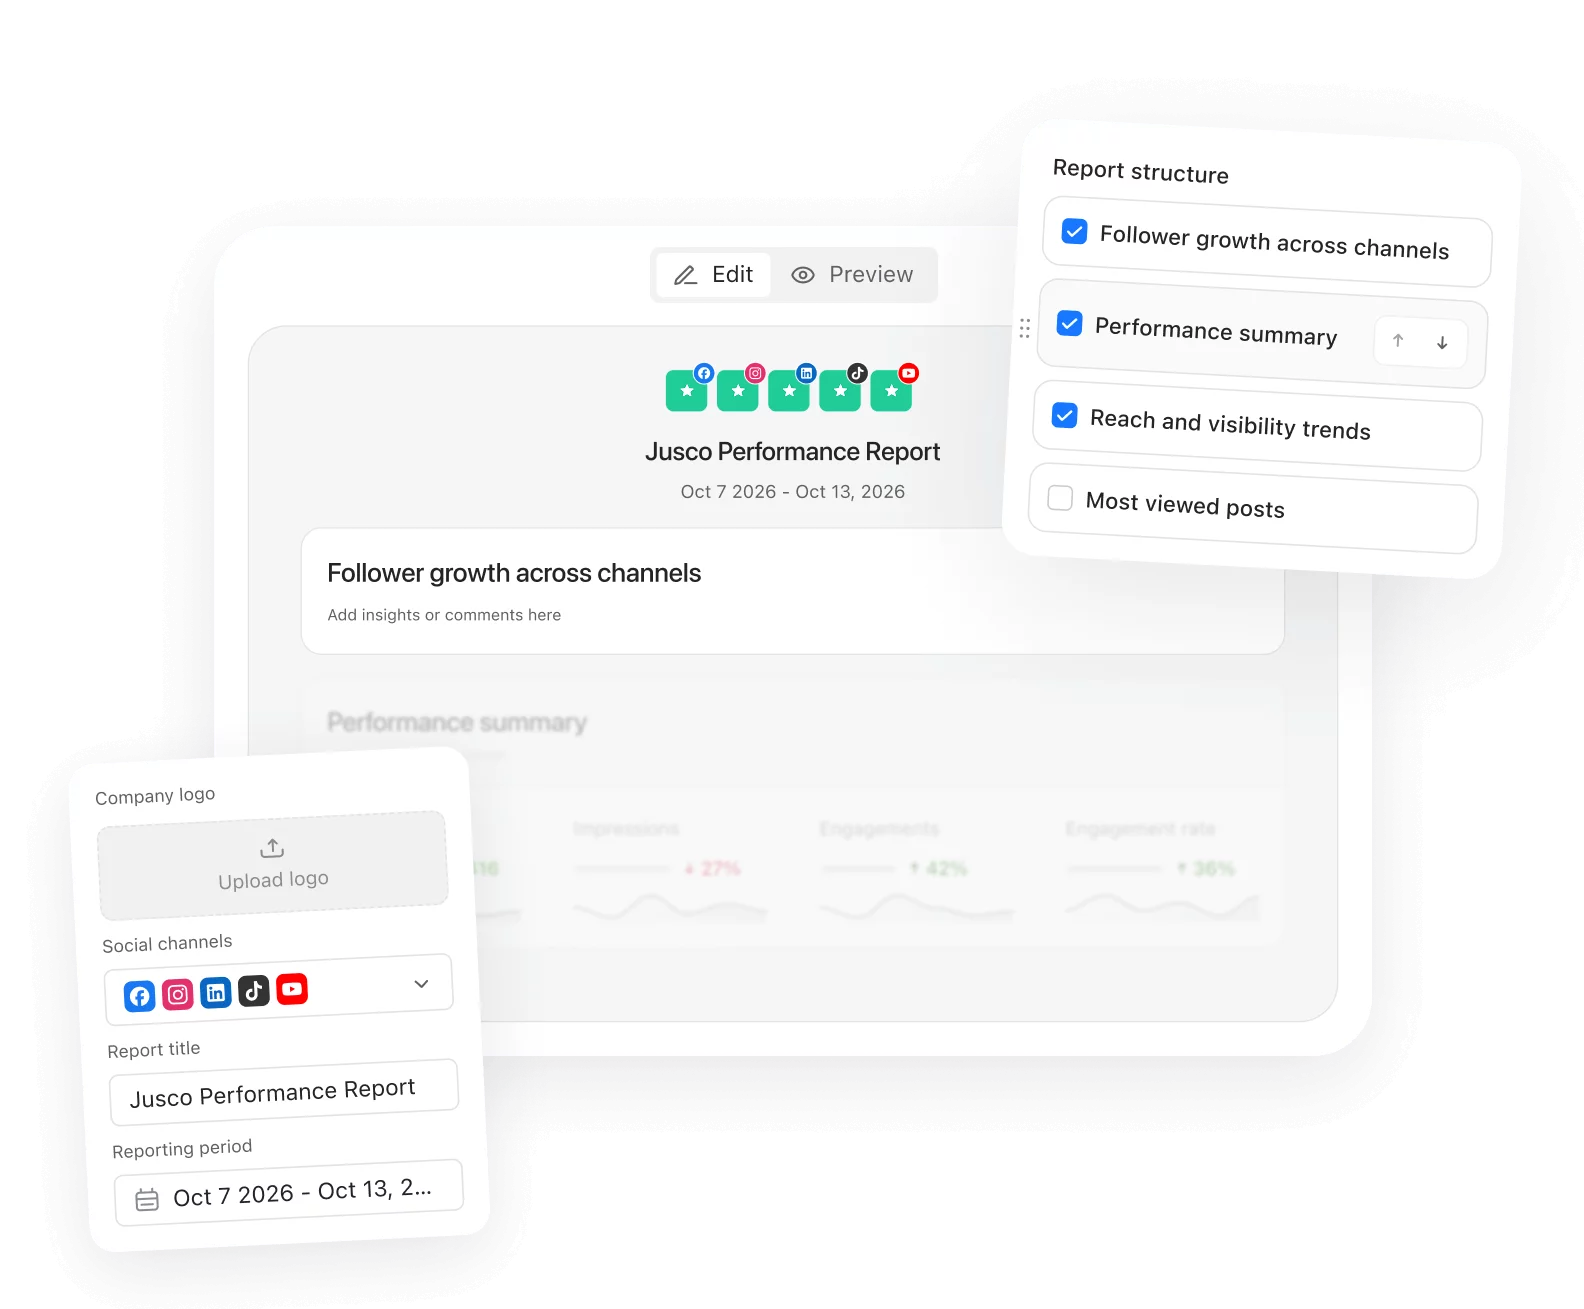
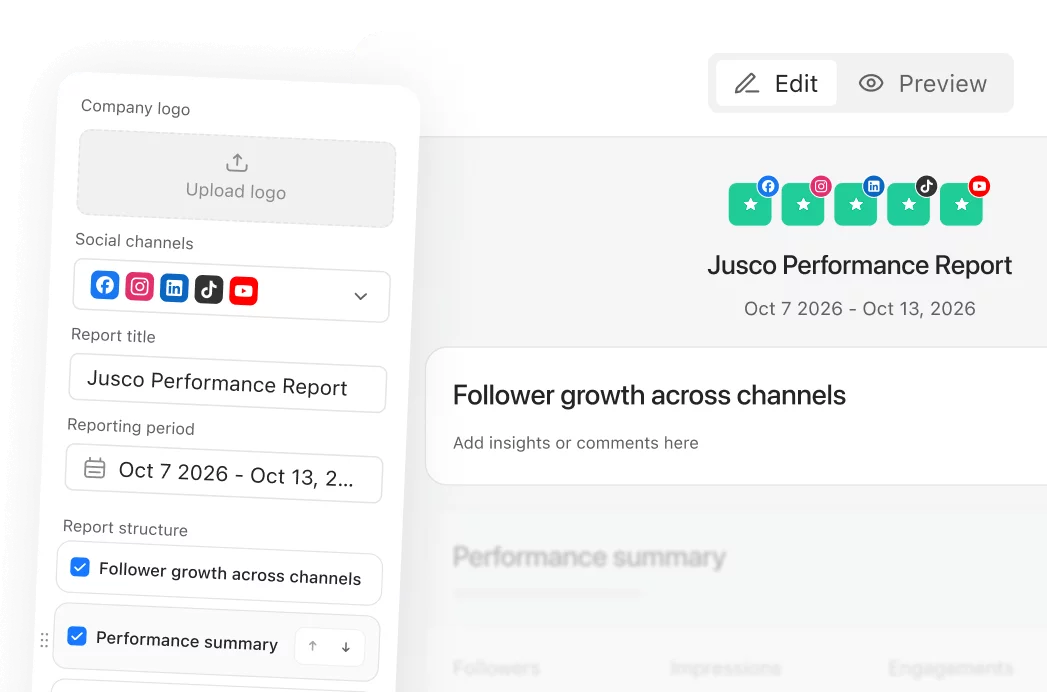
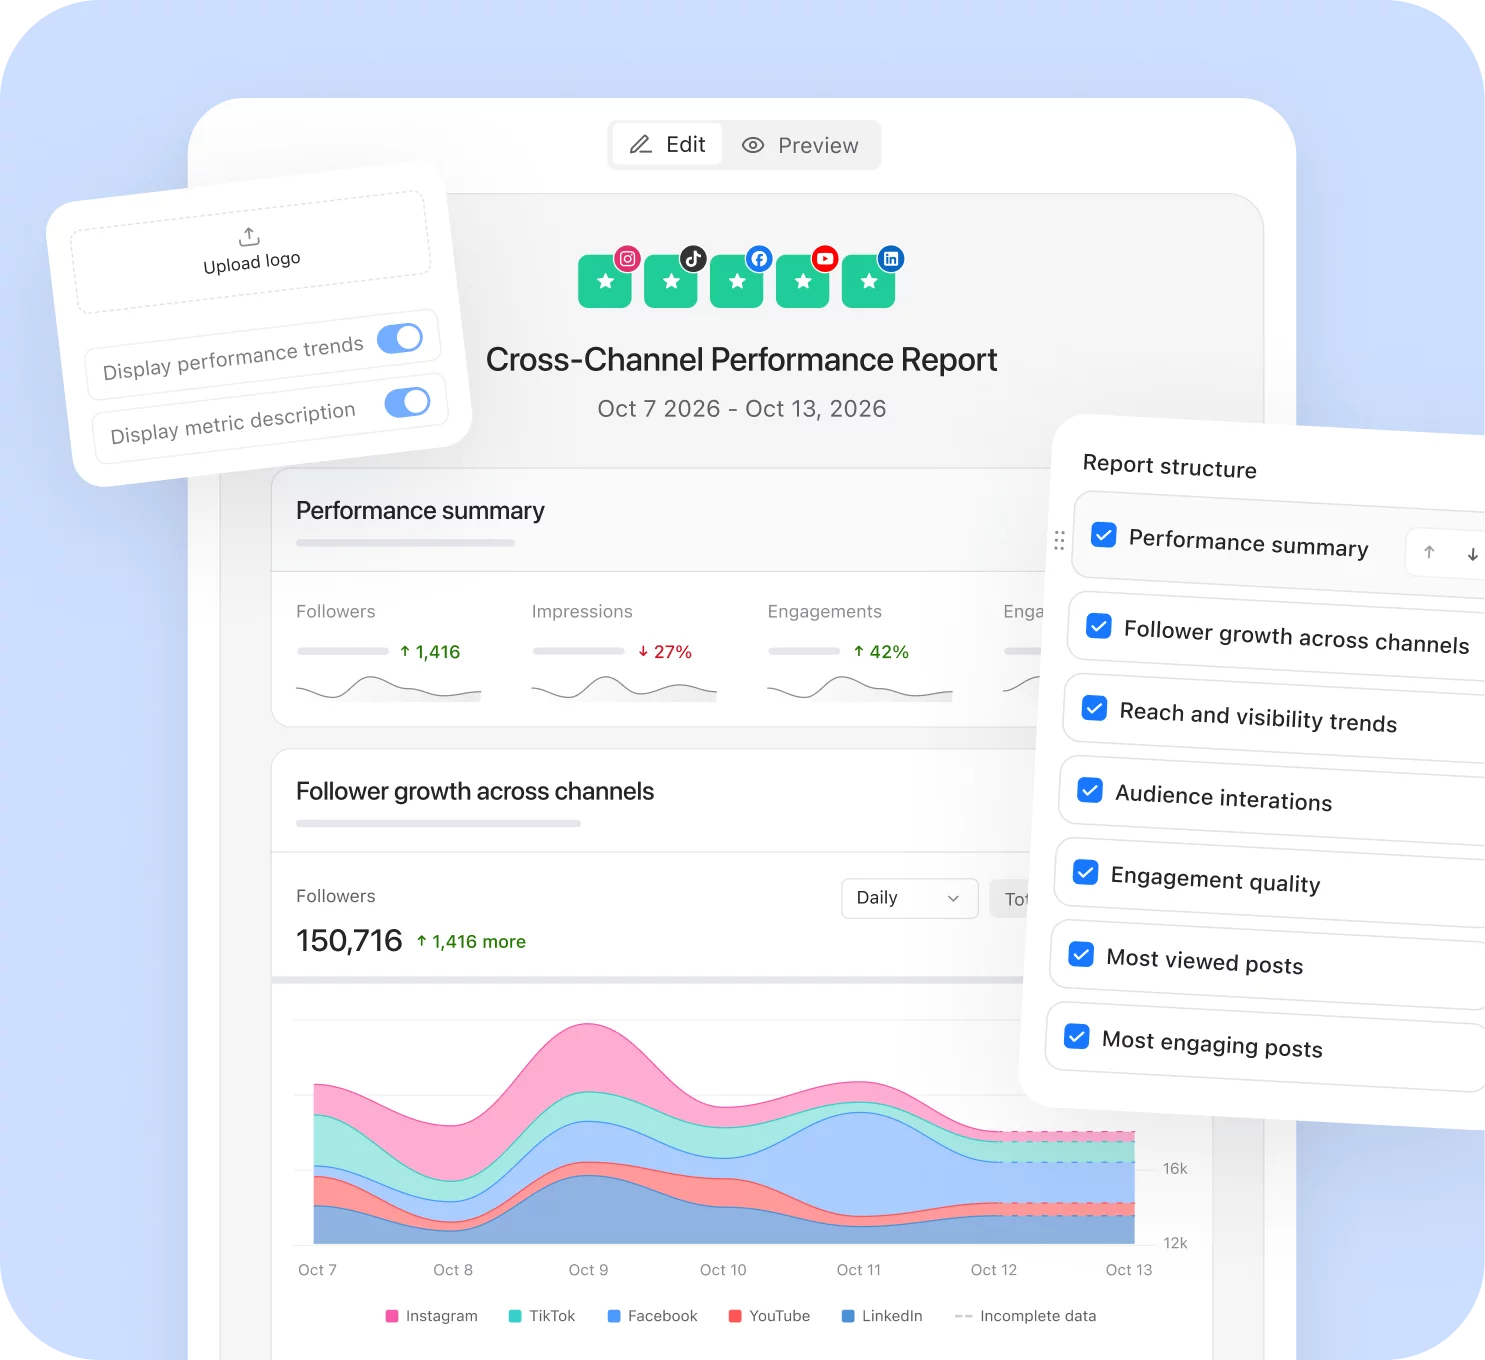
Share your results in customizable reports
Not just numbers, a story of performance: select relevant stats to show and add context before being asked.
In depth insights
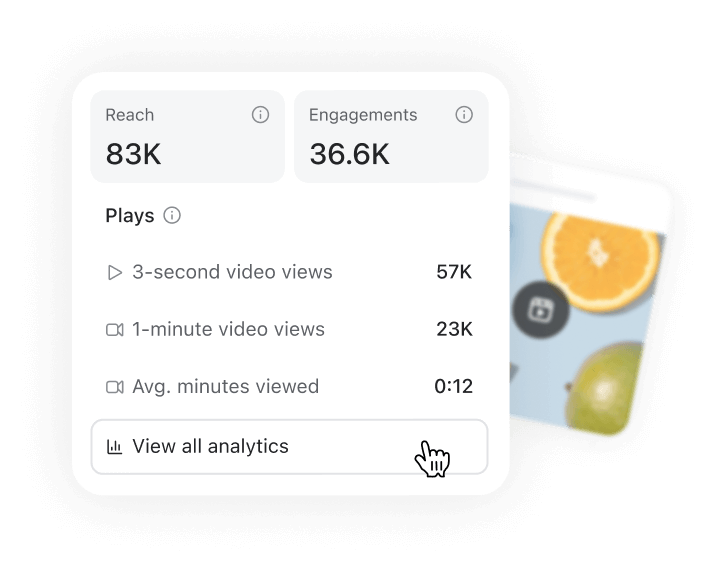
Know when a post needs your attention
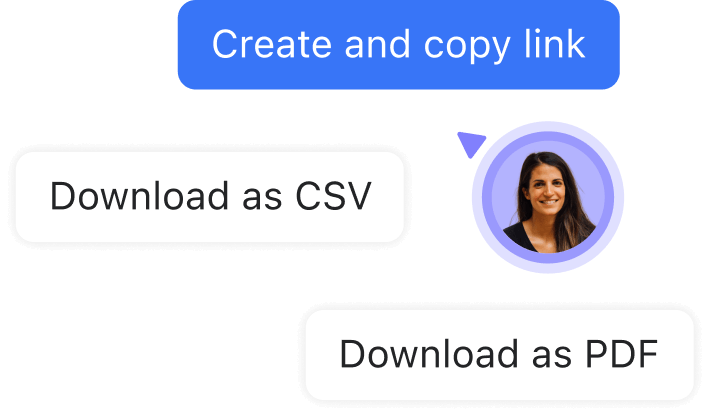
Easy sharing
Send the link, a PDF, or put the data in your own format

Clear overview
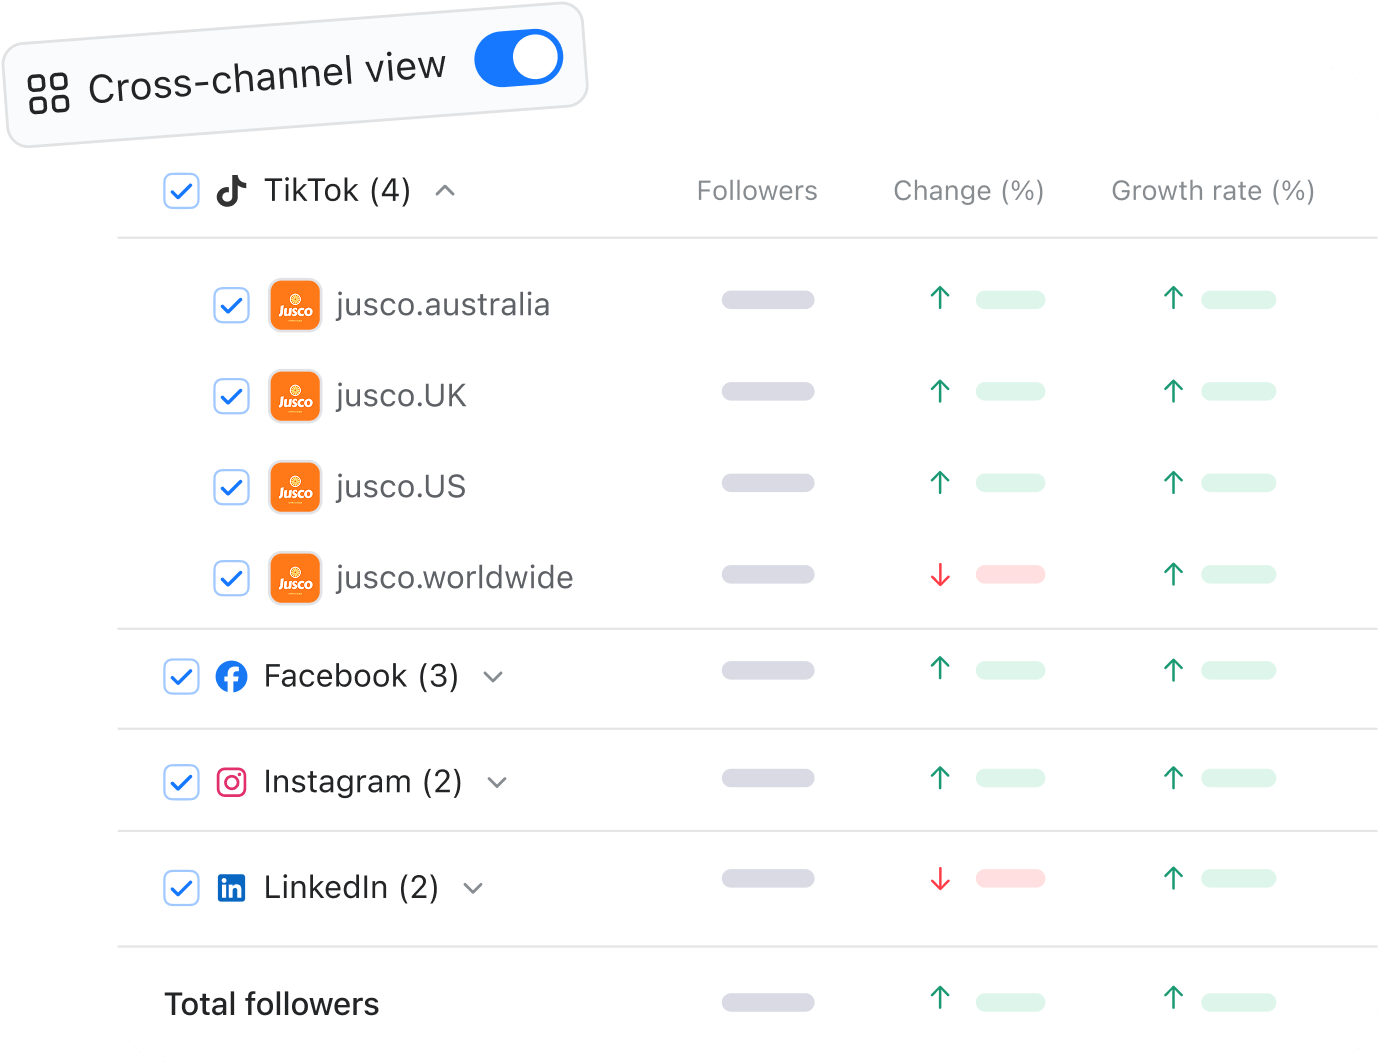
Switch between cross-channel and page-level details
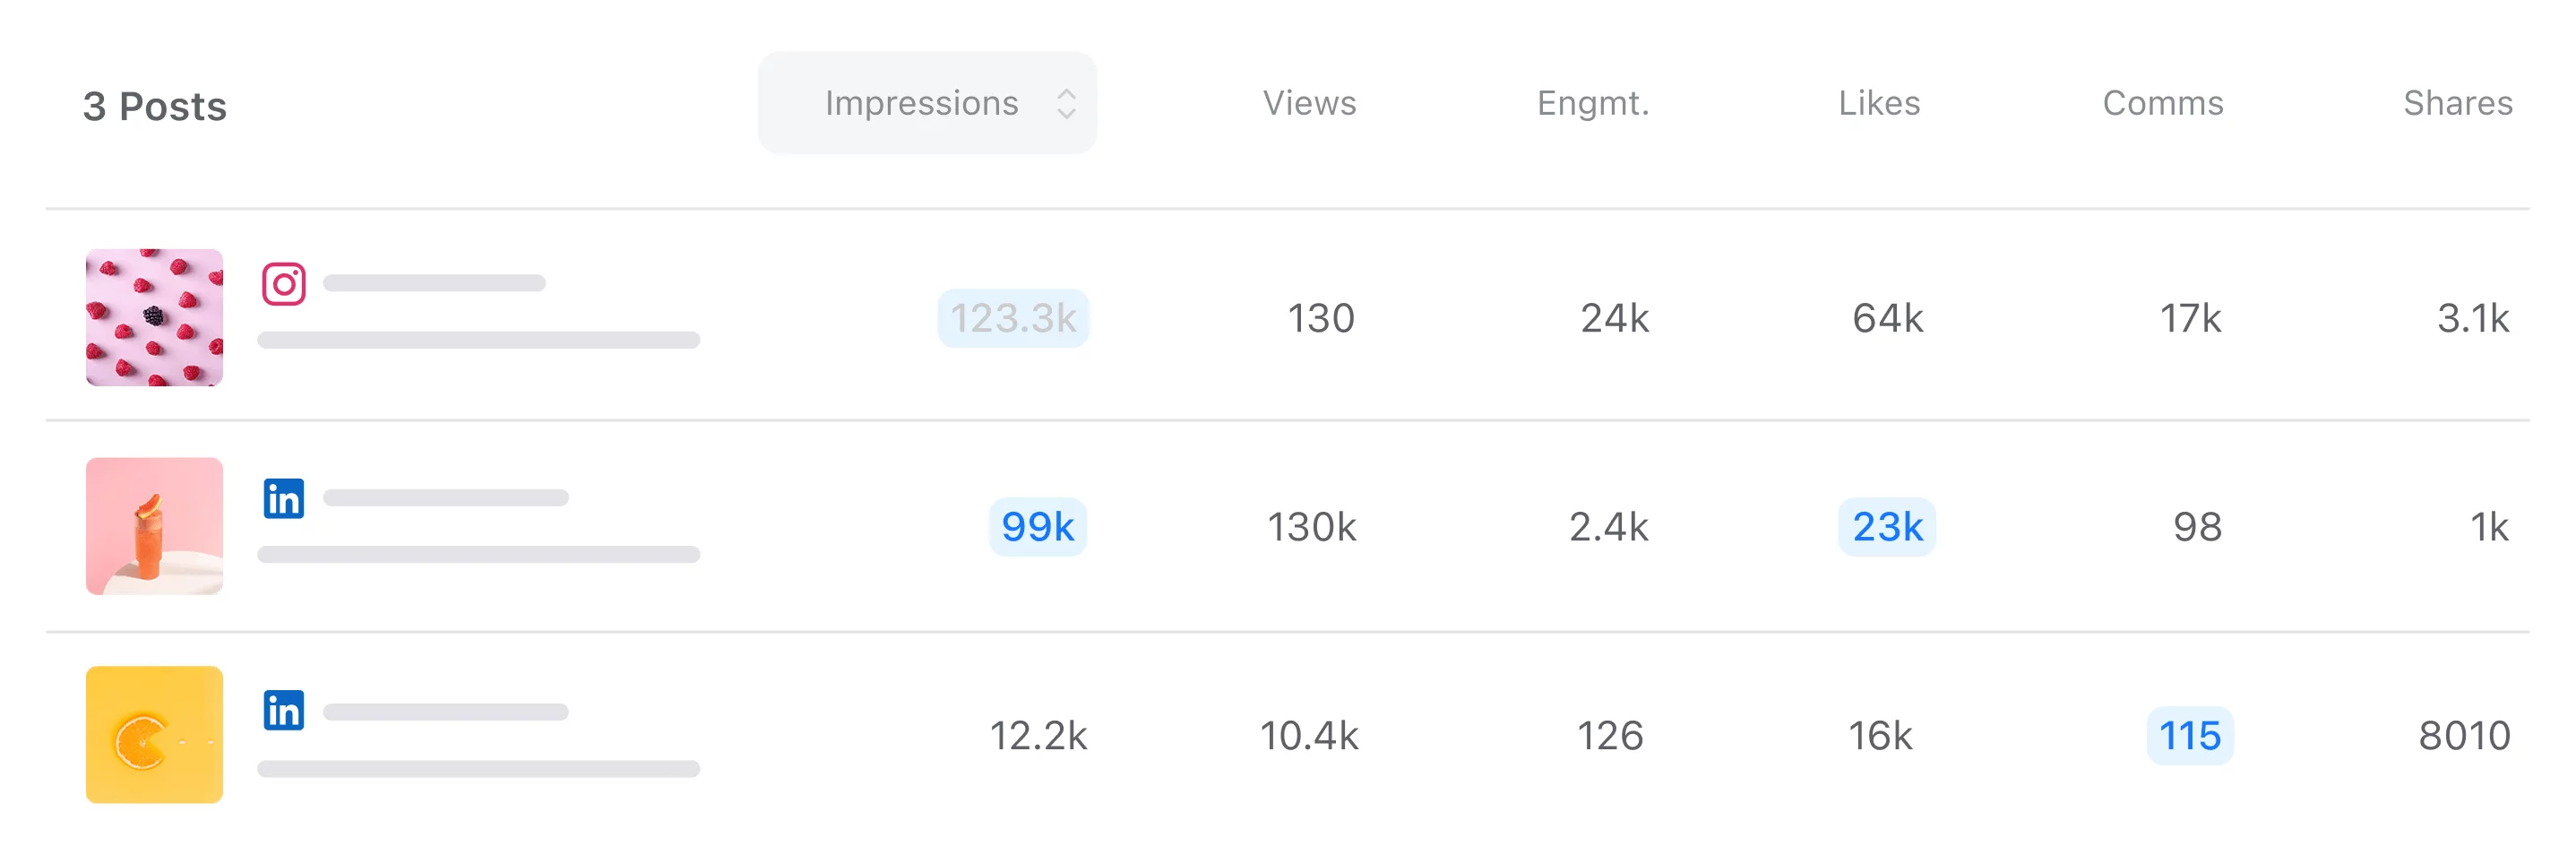
Spot the winning content instantly
See your top-posts based on the metrics that matter and double-down on what works.

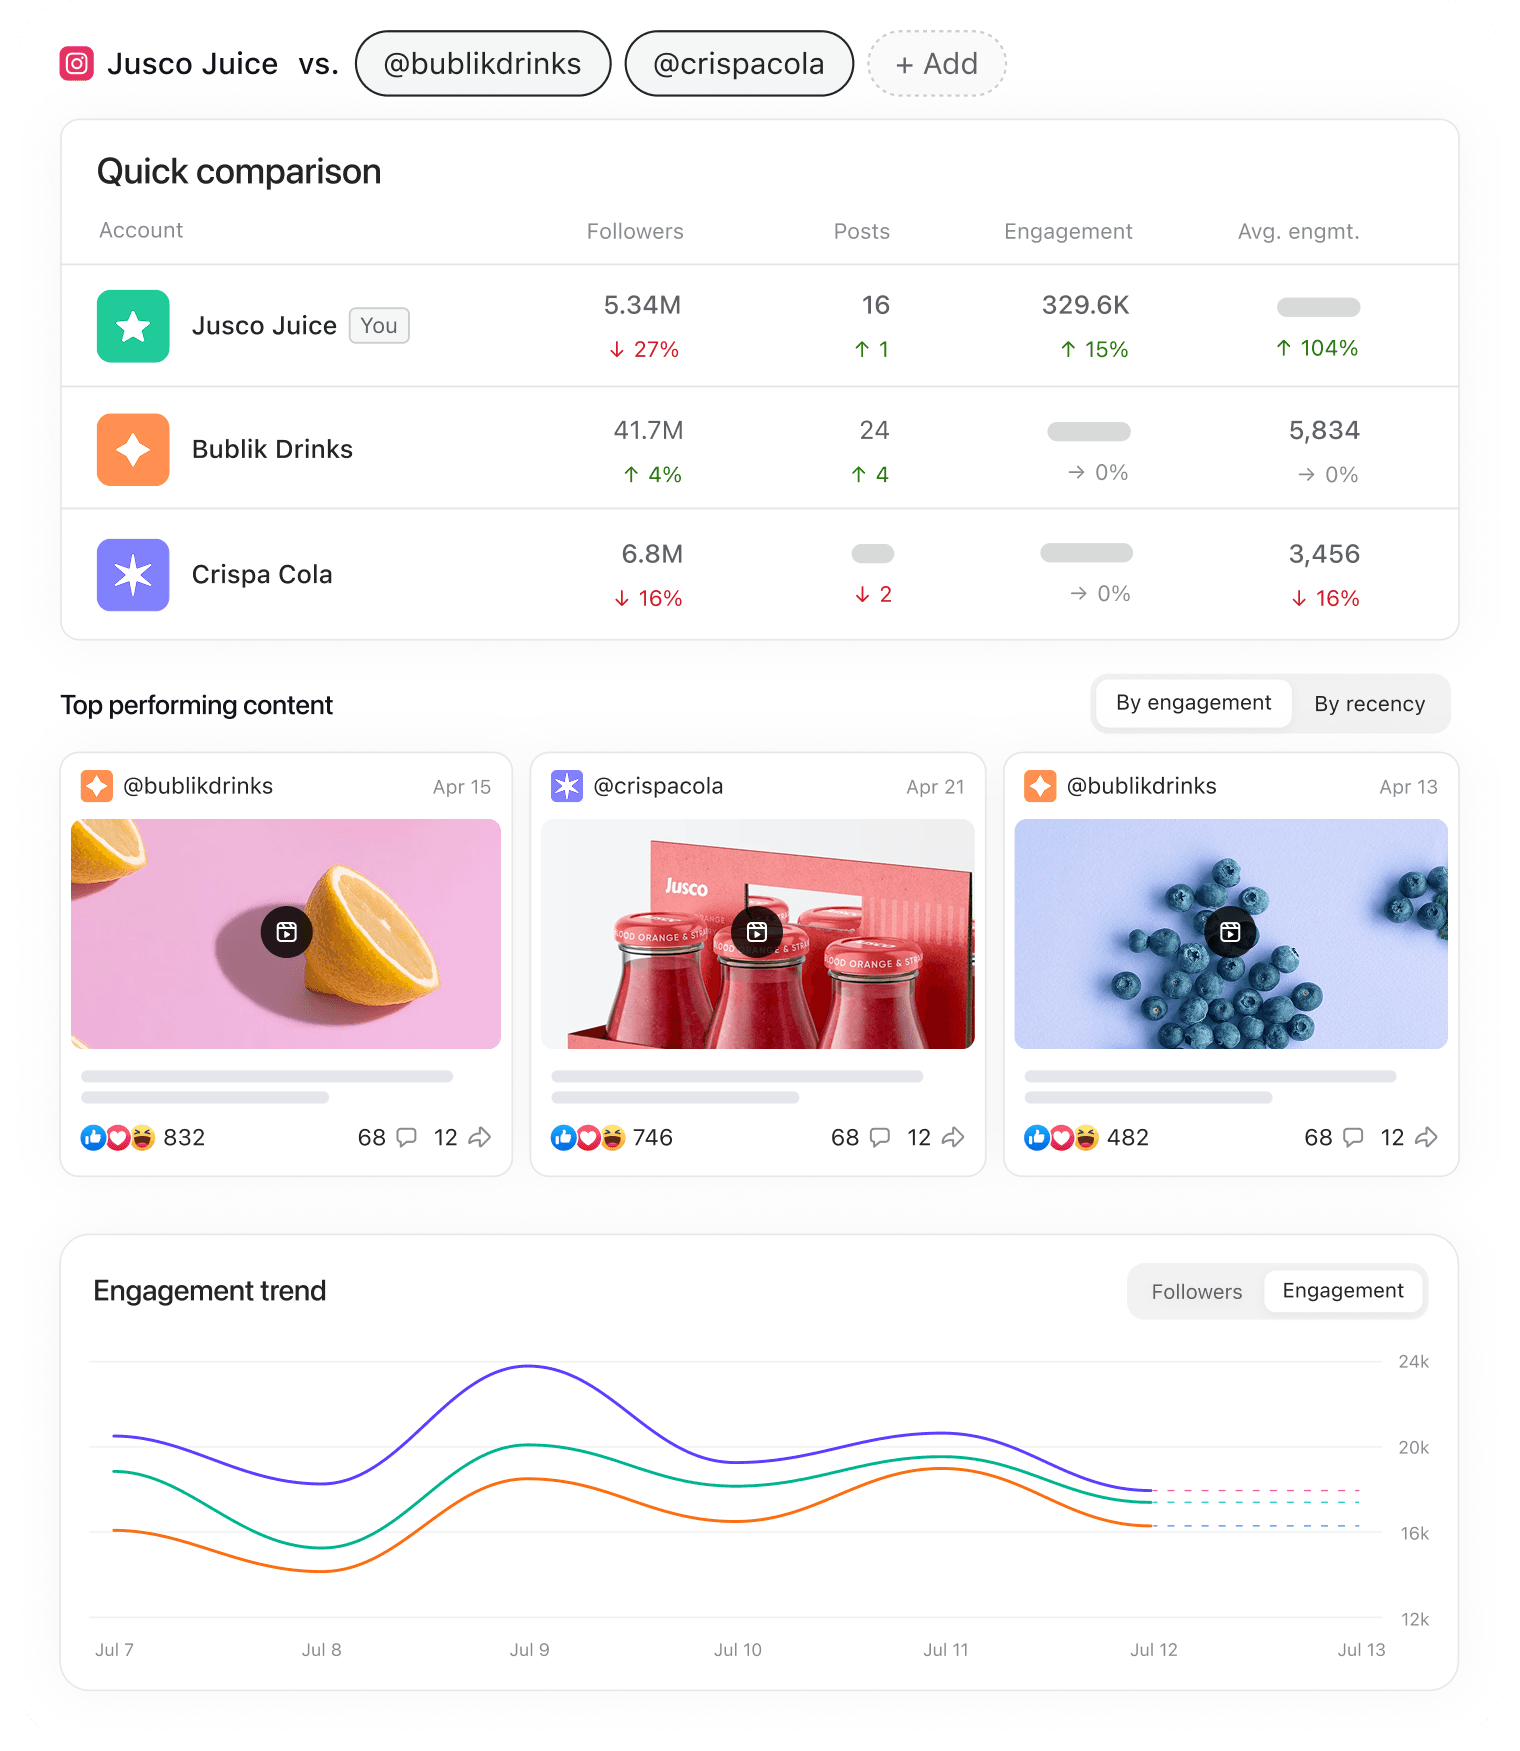
Know where you stand against competitors.
Then know what to do about it
Audience insights for each platform
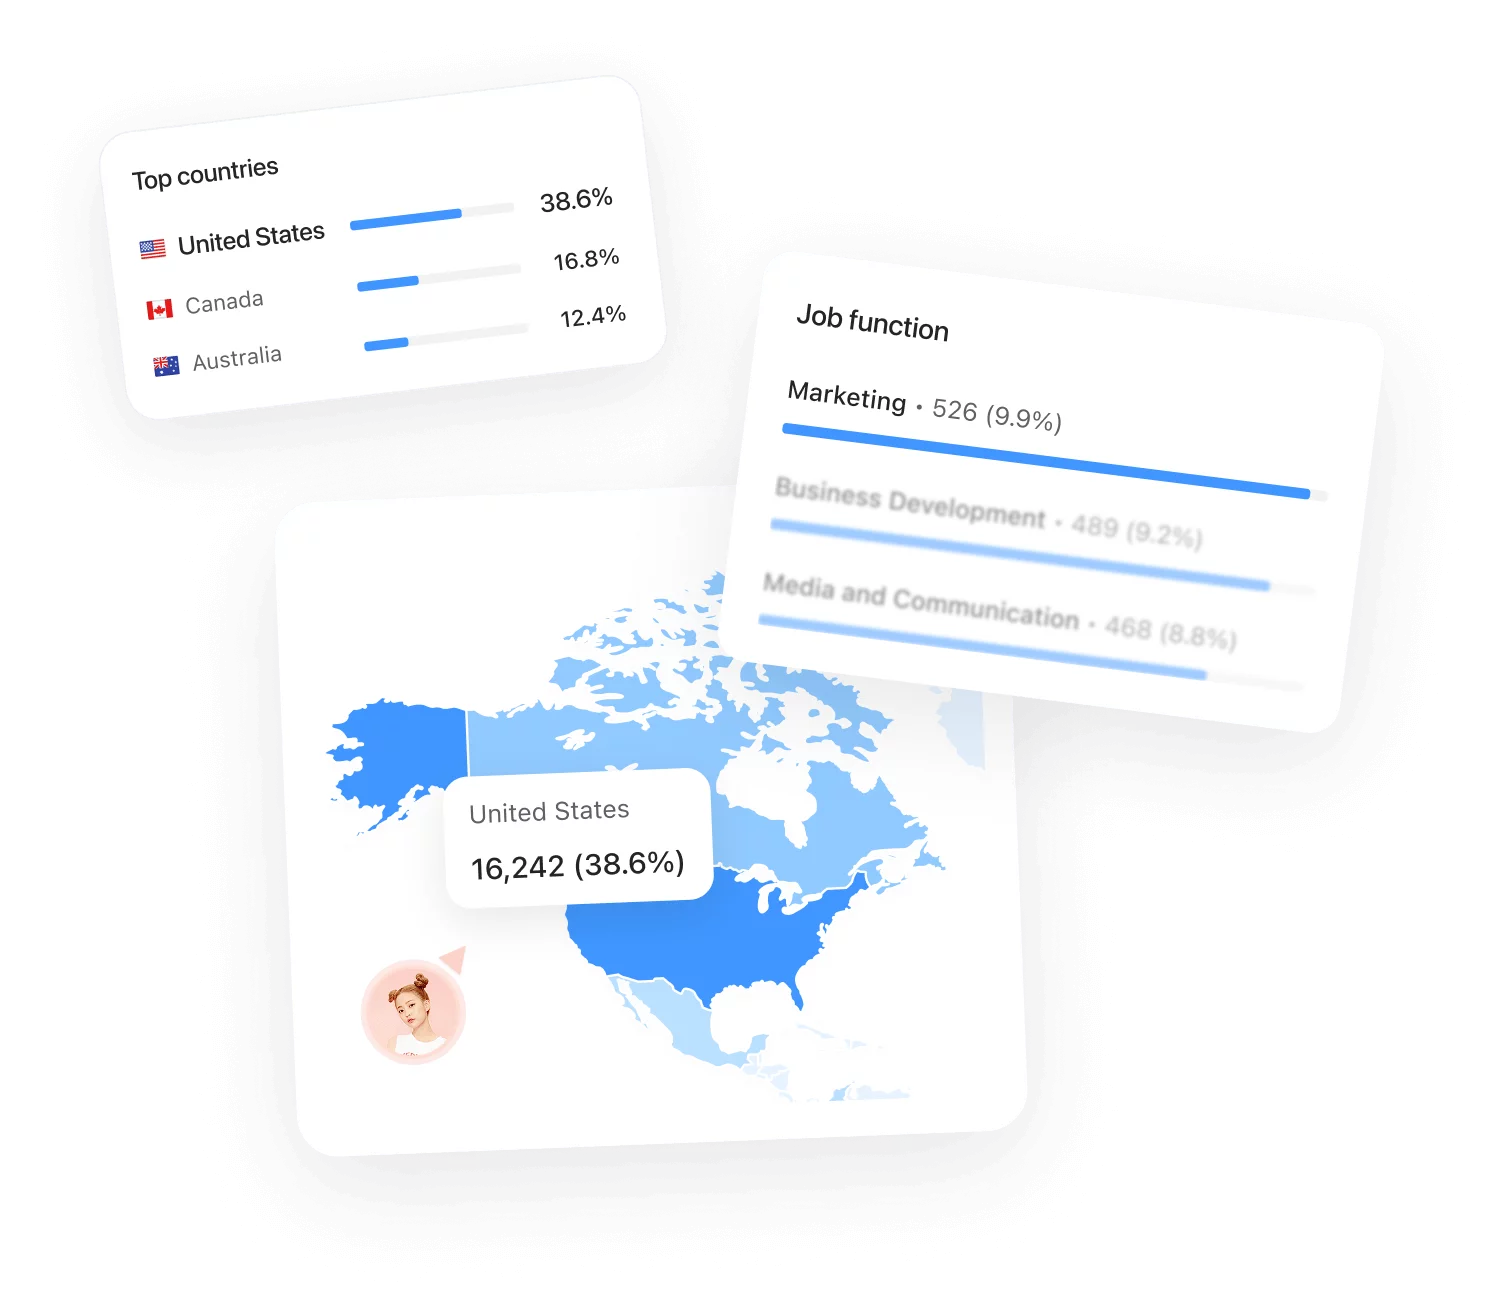
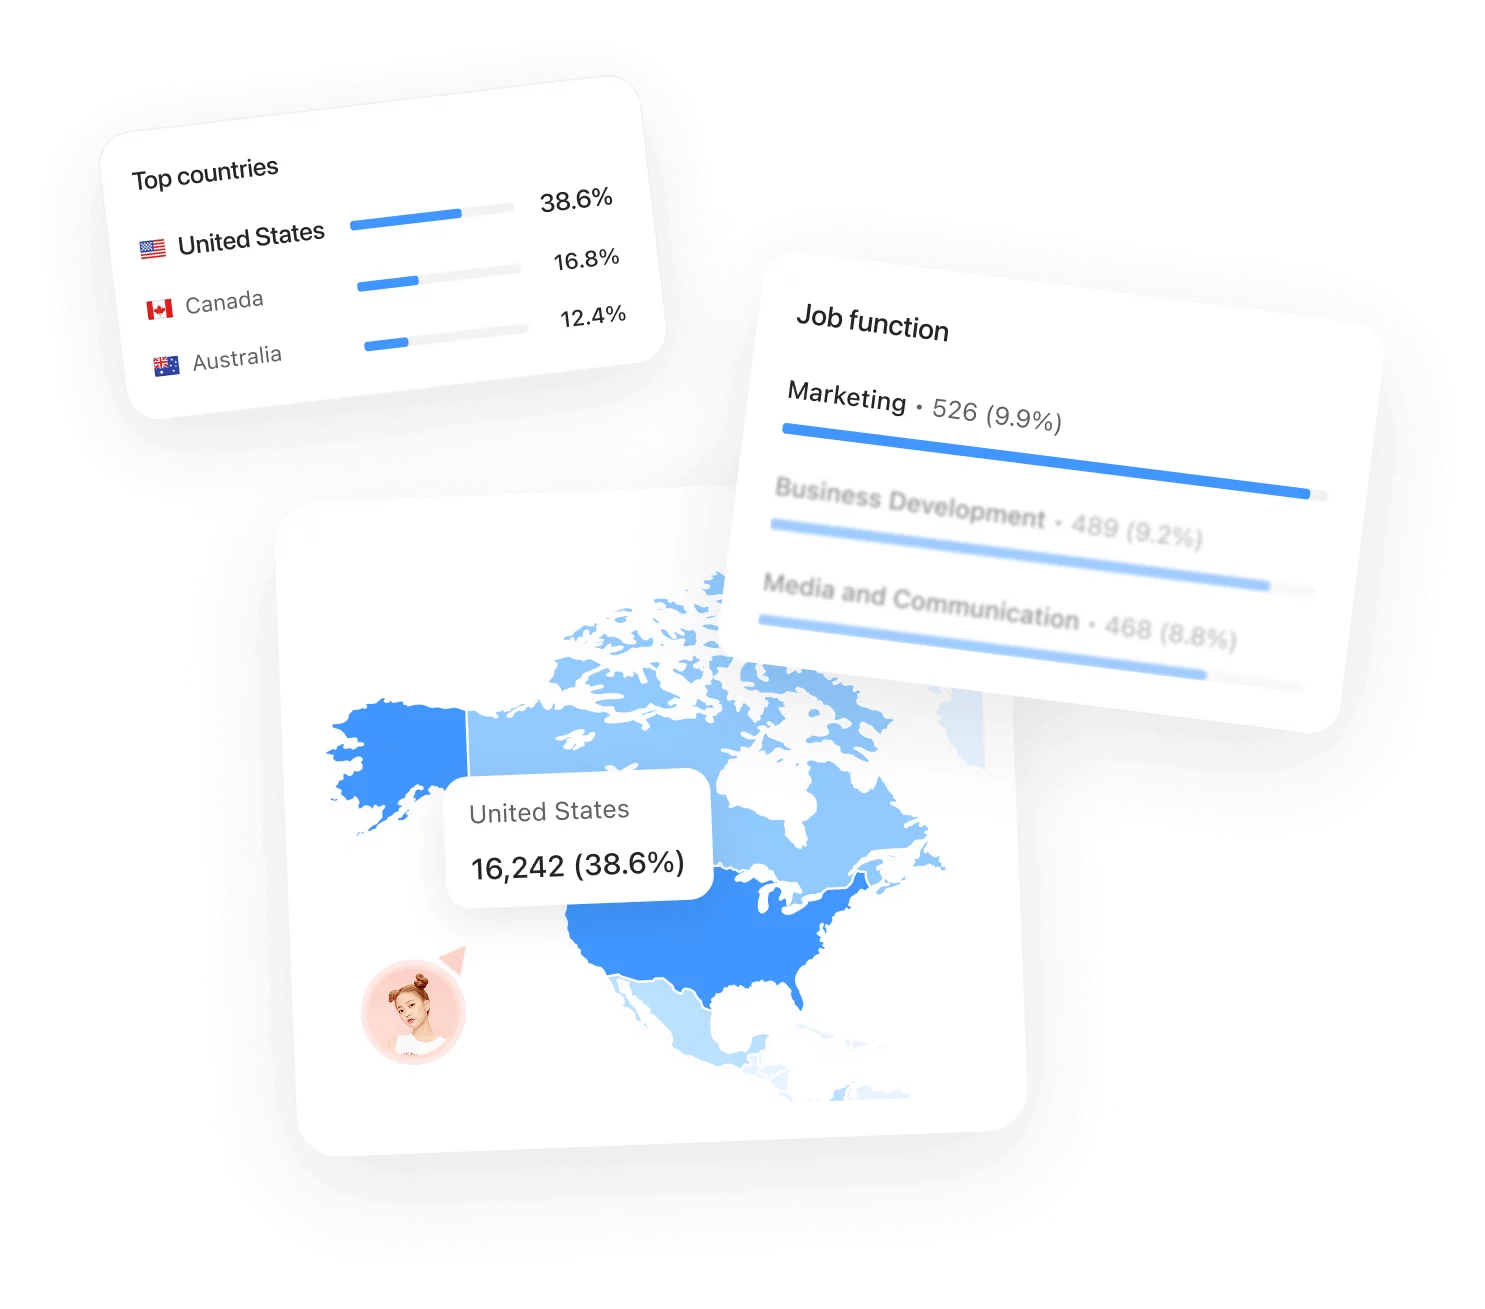
Know your followers’ geographical spread, demographics, or professional info and create content that lands just right.

For agencies that deliver quality at scale
reports created in 2025 by
2025 clients’ favorite:
cross-channel vs.
single-page switch

Create with AI
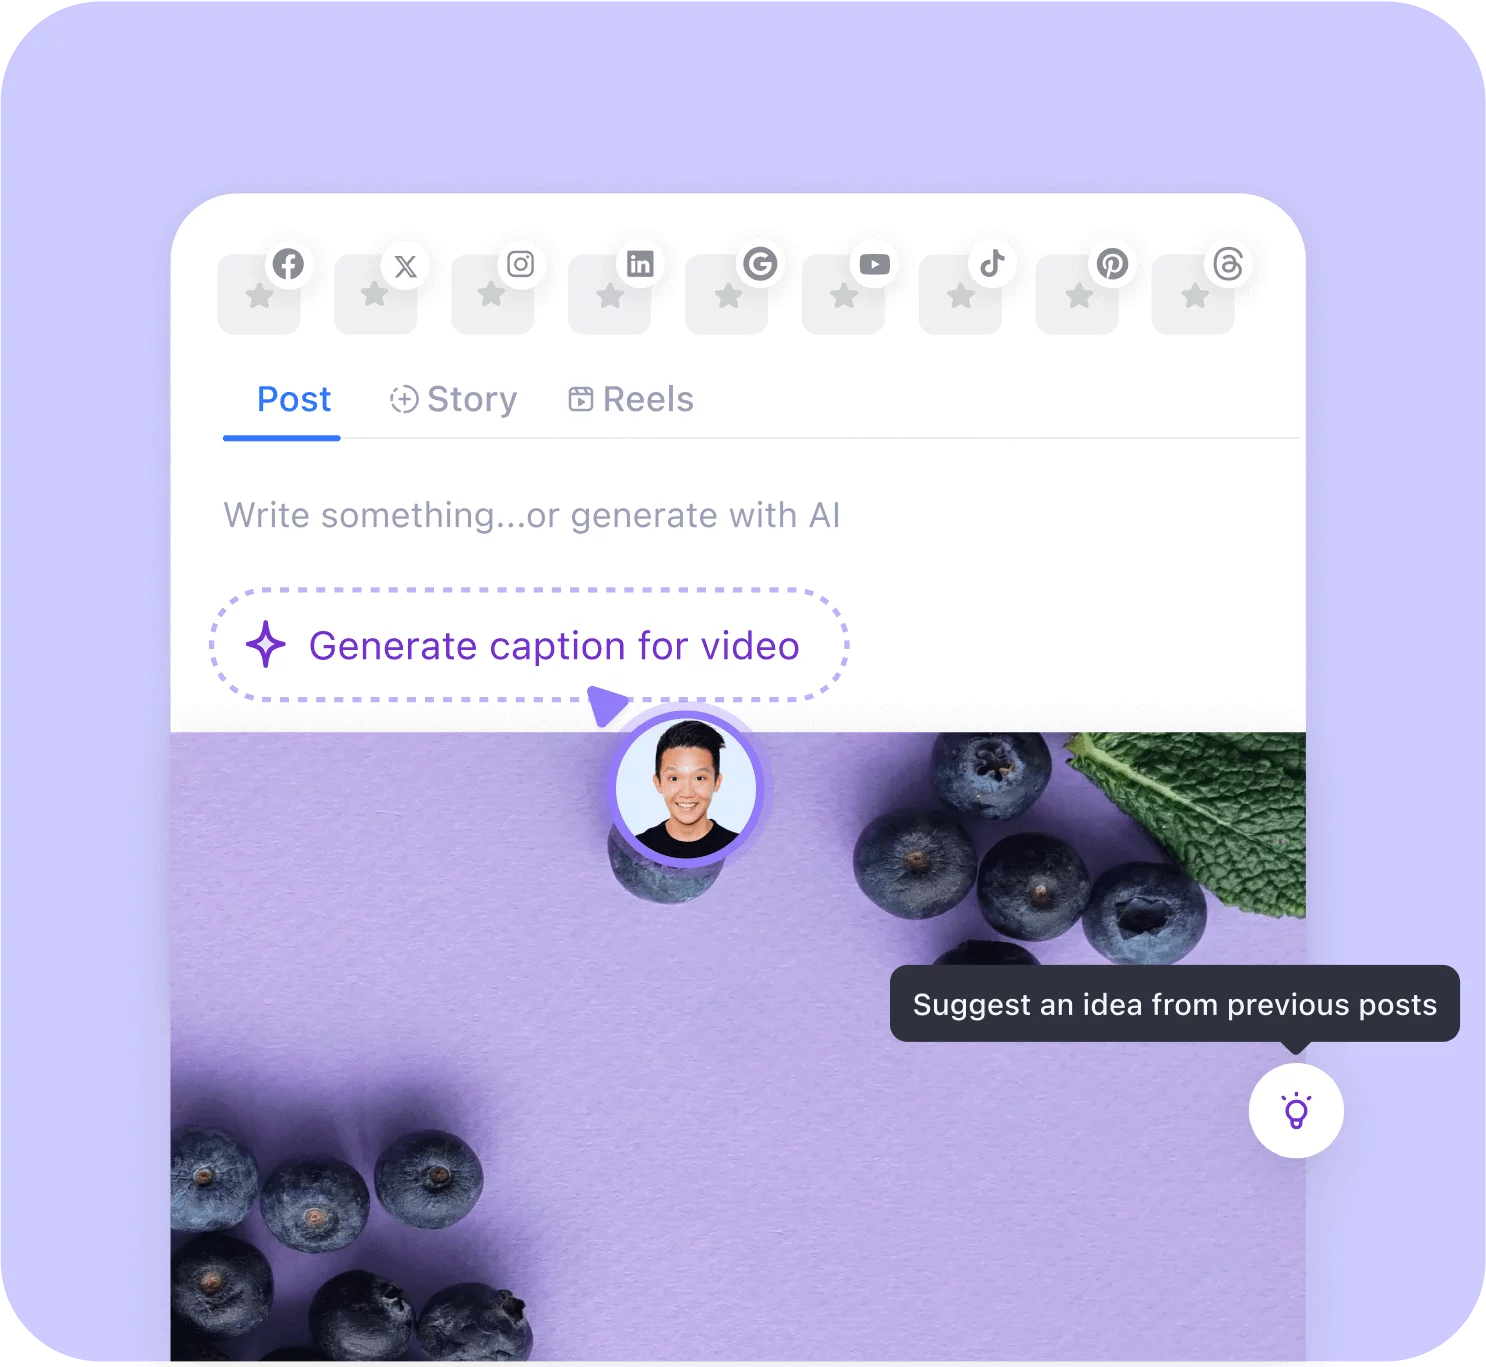
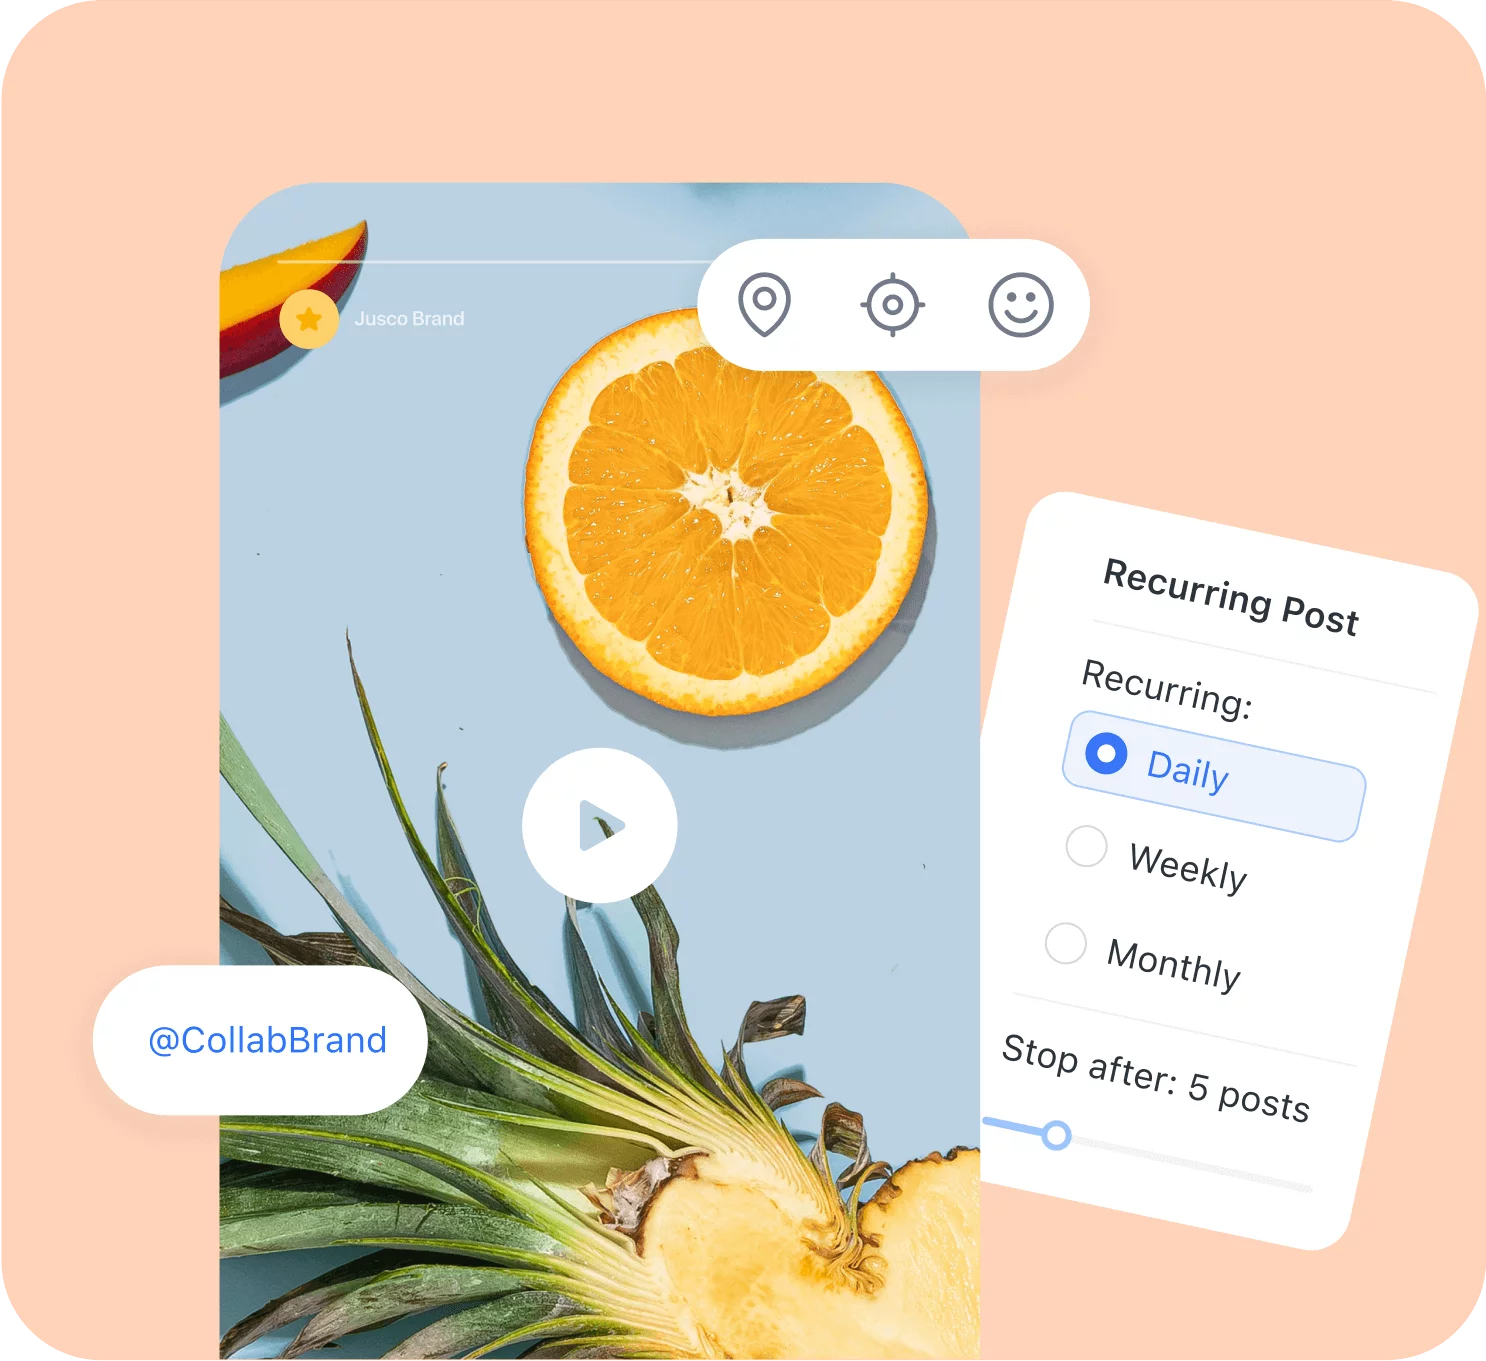
Create single posts, carousels, stories and reels. Plus, get AI caption suggestions based on your images, videos, or previous content.

Plan & organize
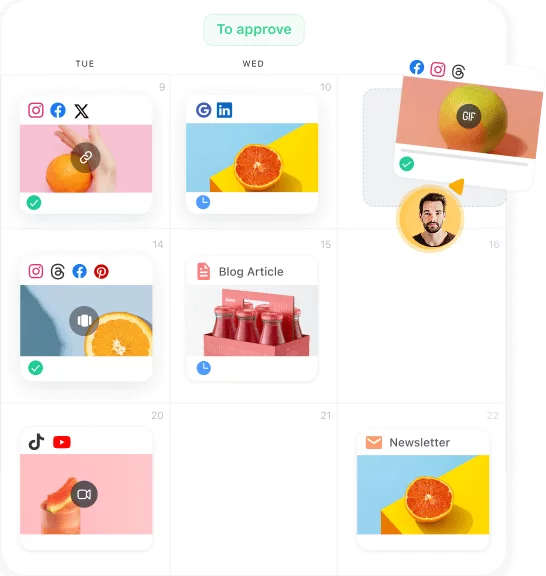
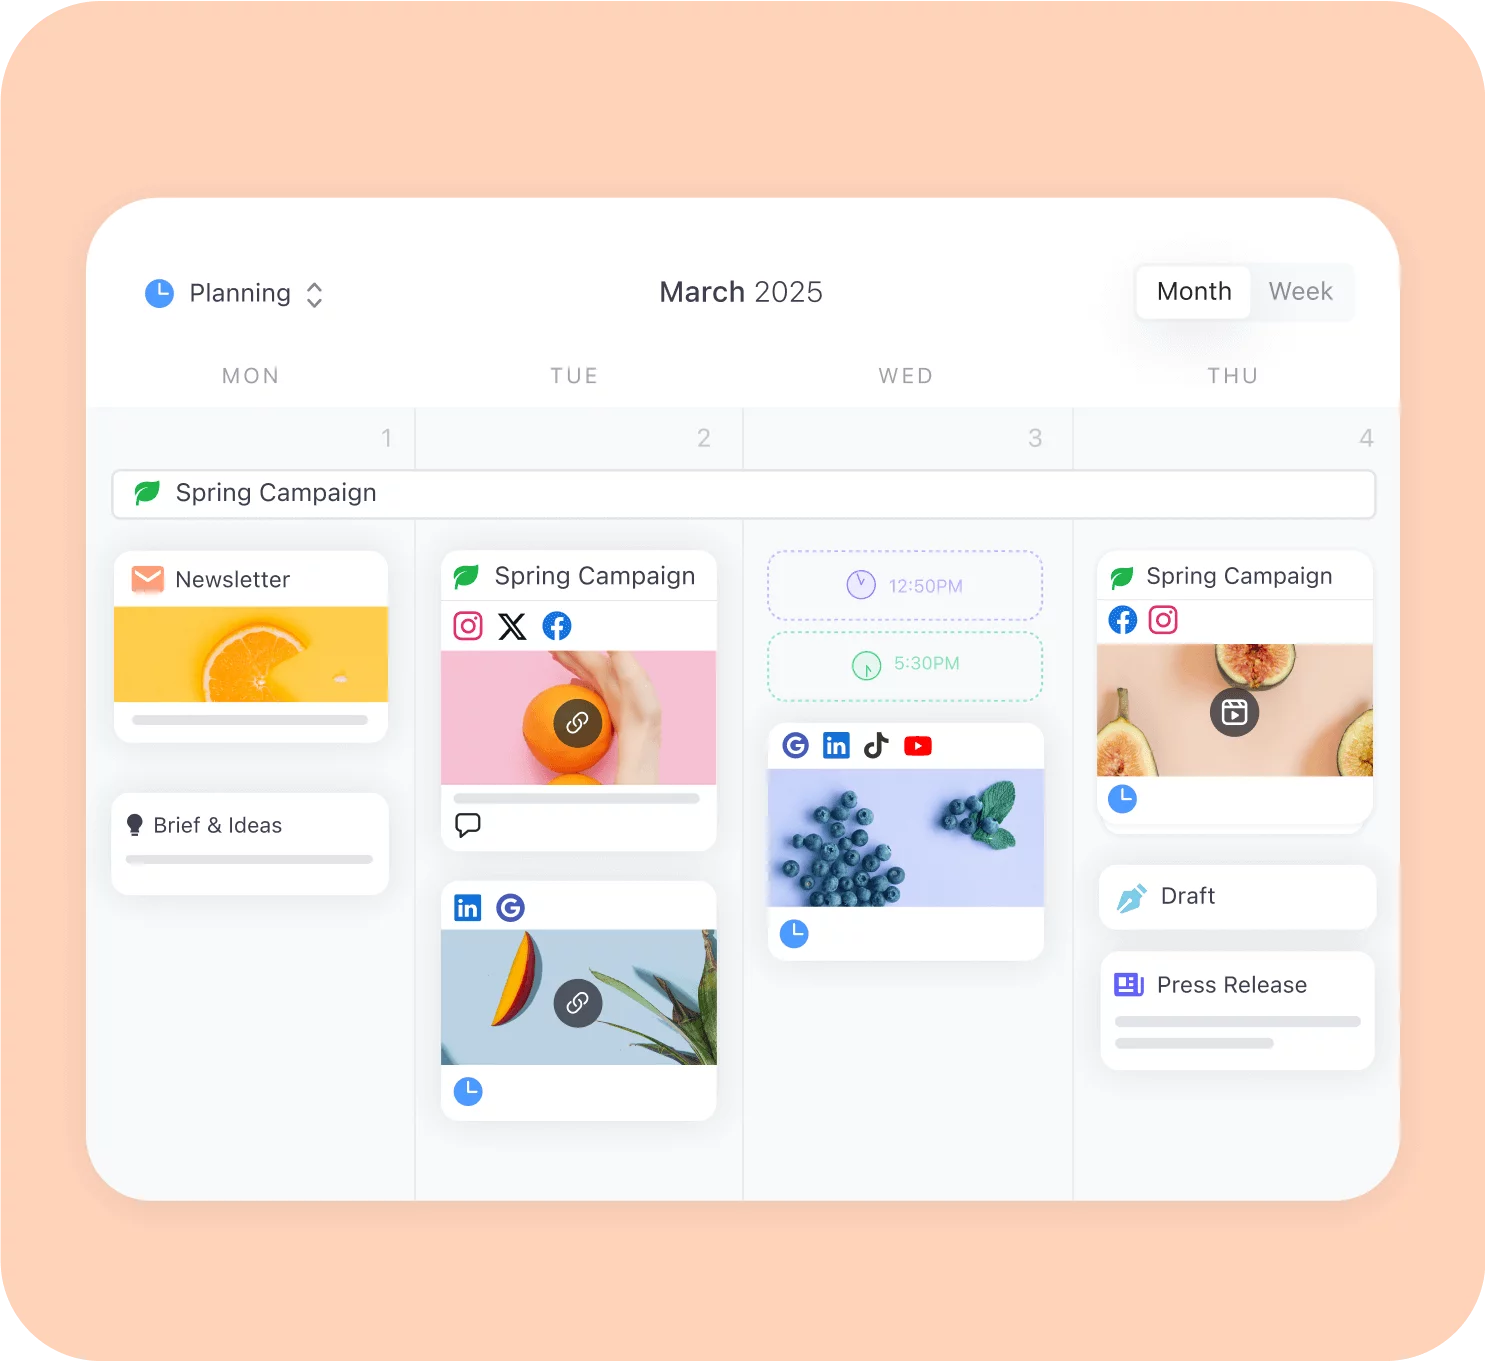
Plan your content in an intuitive calendar. Get organized with campaigns, labels, and advanced filters so you can focus on what matters.

Review & approve
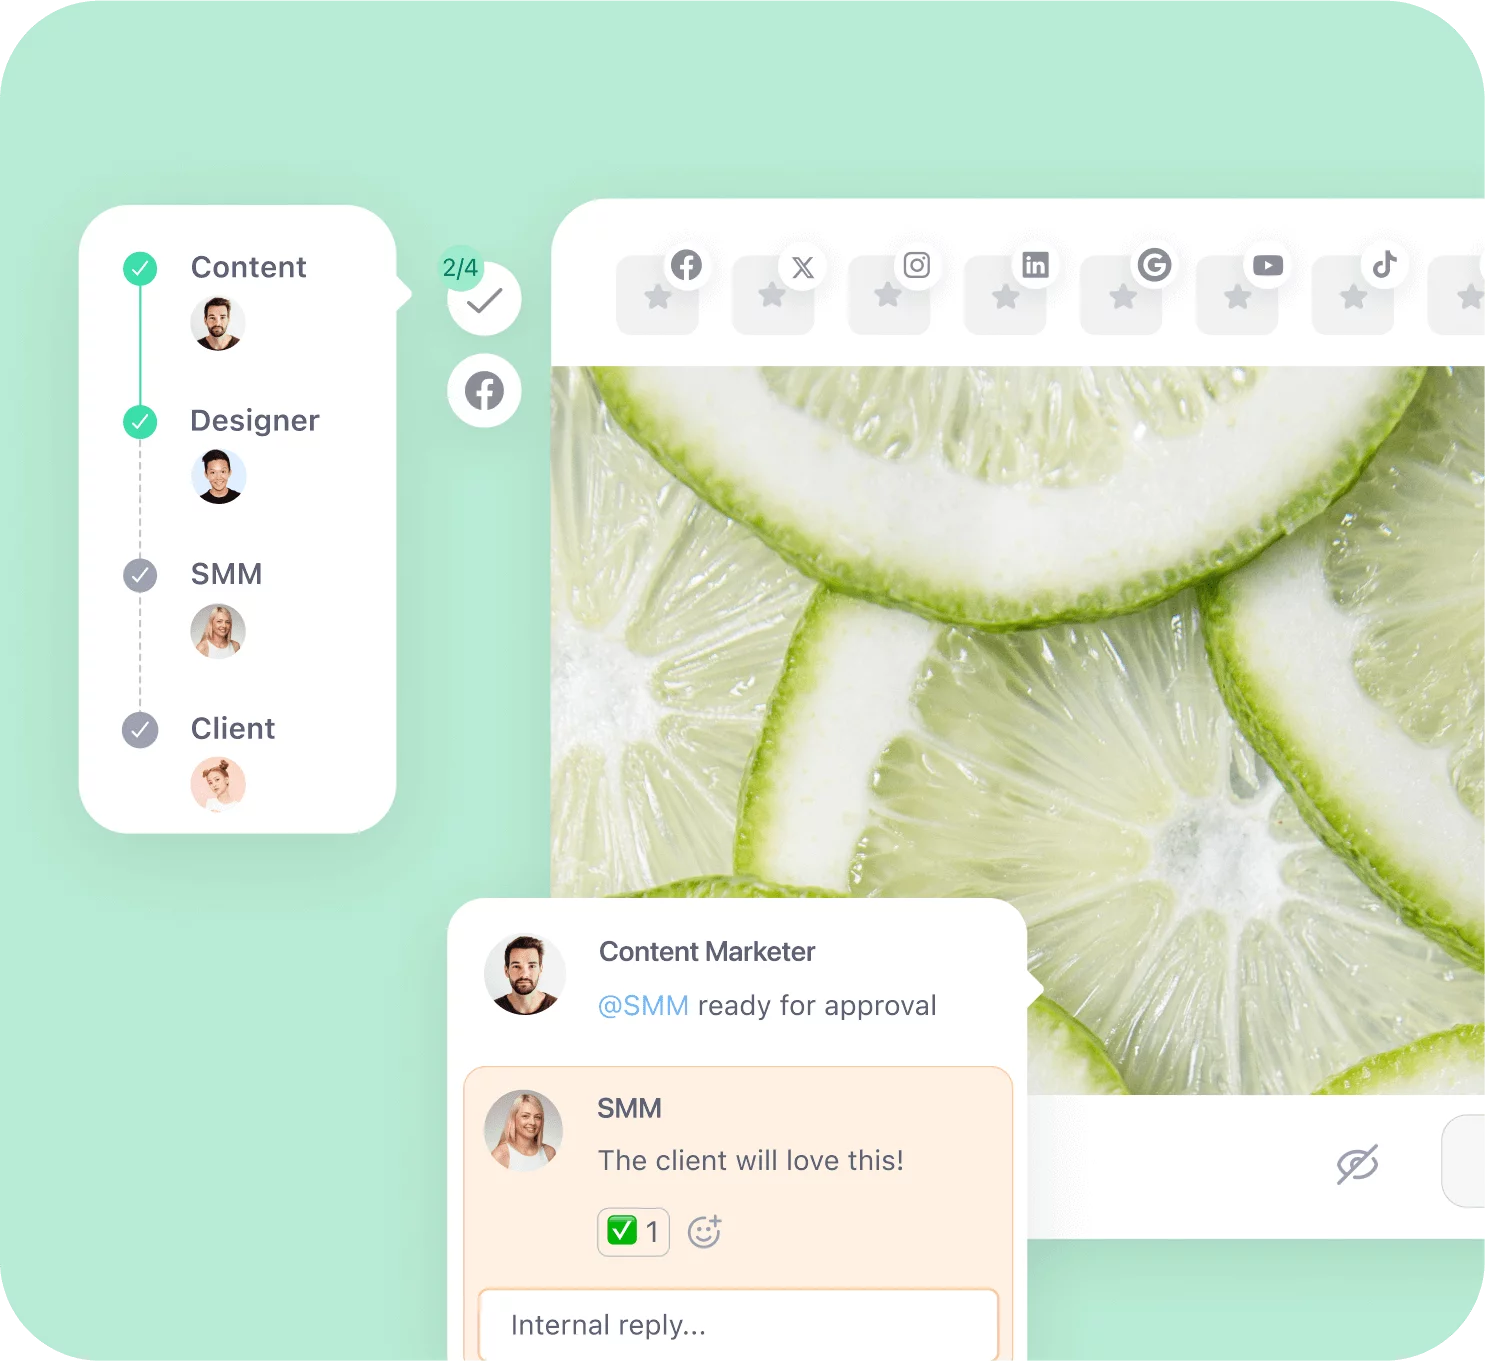
Exchange clear feedback and keep internal work… internal. Then get the green-light with automated approval flows.

Schedule at ease
Preview your content with meticulous clarity and hit schedule with peace of mind. Your content will show up exactly as you envisioned.

Monitor & engage
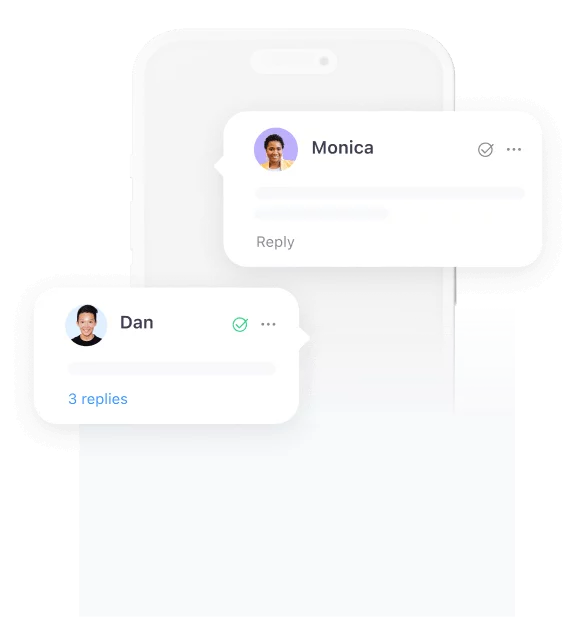
Build stronger connections with your audience. Get instant notifications, reply and react to comments.

Analyze & report
Check your social insights in the cleanest interface. Quickly generate easy-to-read reports and show the value of your work.

Create with AI
Create single posts, carousels, stories and reels. Plus, get AI caption suggestions based on your images, videos, or previous content.
Plan & organize
Plan your content in an intuitive calendar. Get organized with campaigns, labels, and advanced filters so you can focus on what matters.
Review & approve
Exchange clear feedback and keep internal work… internal. Then get the green-light with automated approval flows.
Schedule at ease
Preview your content with meticulous clarity and hit schedule with peace of mind. Your content will show up exactly as you envisioned.
Monitor & engage
Build stronger connections with your audience. Get instant notifications, reply and react to comments.
Analyze & report
Check your social insights in the cleanest interface. Quickly generate easy-to-read reports and show the value of your work.
FAQs
What social media networks does Planable support?
You can create and schedule content in Planable for: Facebook, Instagram, Threads, X, LinkedIn, TikTok, YouTube, Pinterest, and Google Business Profile.
Planable Analytics is currently available for Facebook, Instagram, LinkedIn, TikTok, YouTube, and Google My Business. More platforms will be added soon.
What metrics does Planable Analytics track?
Planable Analytics shows platform statistics over your preferred periods of time.
Facebook: followers, number of posts, impressions, engagement, page views
Instagram: followers, reach, impressions, engagement, profile visits, followers location map, top countries, top cities, gender & age distribution
LinkedIn: followers, number of posts, impressions, engagement, page views, followers location map, top countries, top cities, job functions, seniority levels
TikTok: followers, video views, profile views, engagement, followers location map, top countries, gender distribution
YouTube: subscribers, number of videos posted, views, watch time, average view duration, top geographies, gender and age distribution, engagement, likes, comments, shares
Google My Business: views, searches, calls, bookings, directions toward location, clicks to website
For each specific post, go more in-depth on impressions, engagement, views/plays, reactions, comments, reposts, and clicks.
Find more detailed information here.

Does Planable Analytics show historical data?
Yes. Planable Analytics will show up to 12 months of past data, according to each social network’s limitations.
Does Planable Analytics include data for posts that are natively posted?
Yes. For each social media page, you can enable the “sync content” option, which will automatically bring the post’s analytics to your Planable dashboard.
Does Planable Analytics cover organic and paid posts?
Planable Analytics shows aggregated metrics for both organic and paid posts.
How much does Planable Analytics cost?
Planable Analytics is an add-on available for all Planable paid plans. The price for Analytics is $14/month per workspace, and it comes with a 30-day free trial period.
How do I start my free trial?
As you’re logged into your account*, check out this page, and select all the workspaces for which you wish to enable Analytics.
You can also find Analytics in each workspace under your Views tab and follow the instructions.
Note that only workspace owners and users with billing rights can activate the free trial.
* The Planable Analytics free trial is available only on a paid plan.