Social CRM is your ticket to high-quality real-time engagement with customers, on the platforms where they already hang out. You'll get solid data on behavior and sentiment with unprecedented granularity. Social CRM tools empower sales and marketing teams to deliver a...
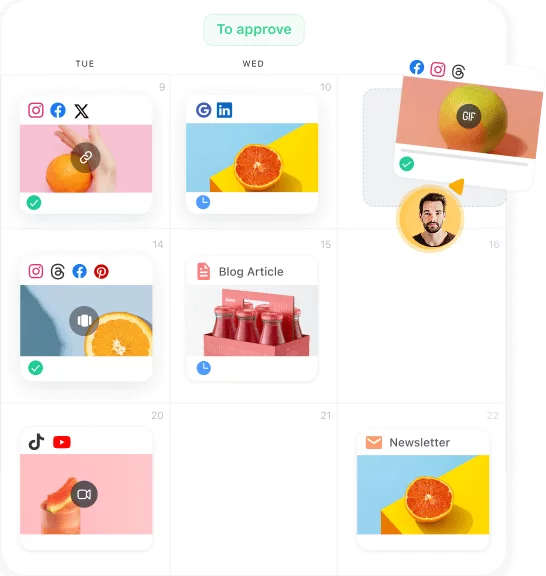
Redesign For multi-location brands
all your locations, one content flow
For multi-brand companies
content collaboration at scale
For agencies
impress your clients and take on more
“The team loved it from the start. Planable helps us overview the entire marketing efforts.“
It’s not Christmas just yet, but you know we show love all year round. Soooo…. we’ve got another gift. A free report on social media captions. What works best, what other brands do, hashtags, emojis, contests, and whatnot.
And this time, we’ve partnered up with our friends at Socialinsider to help you raise your social media engagement in 2020.
We took a close look at over 101 million posts from 178,463 profiles across Facebook, Twitter, and Instagram to figure out what the most engaging posts have in common.
We looked at the potential of each platform, the impact the caption length can have, what the use of emojis can do, questions and even special activations.
Download the study to learn how to write the perfect captions on Facebook, Instagram, and Twitter⇣
Here are some of the main things you’ll find in the study.
Social media captions study summary:
In this study, you’ll discover:
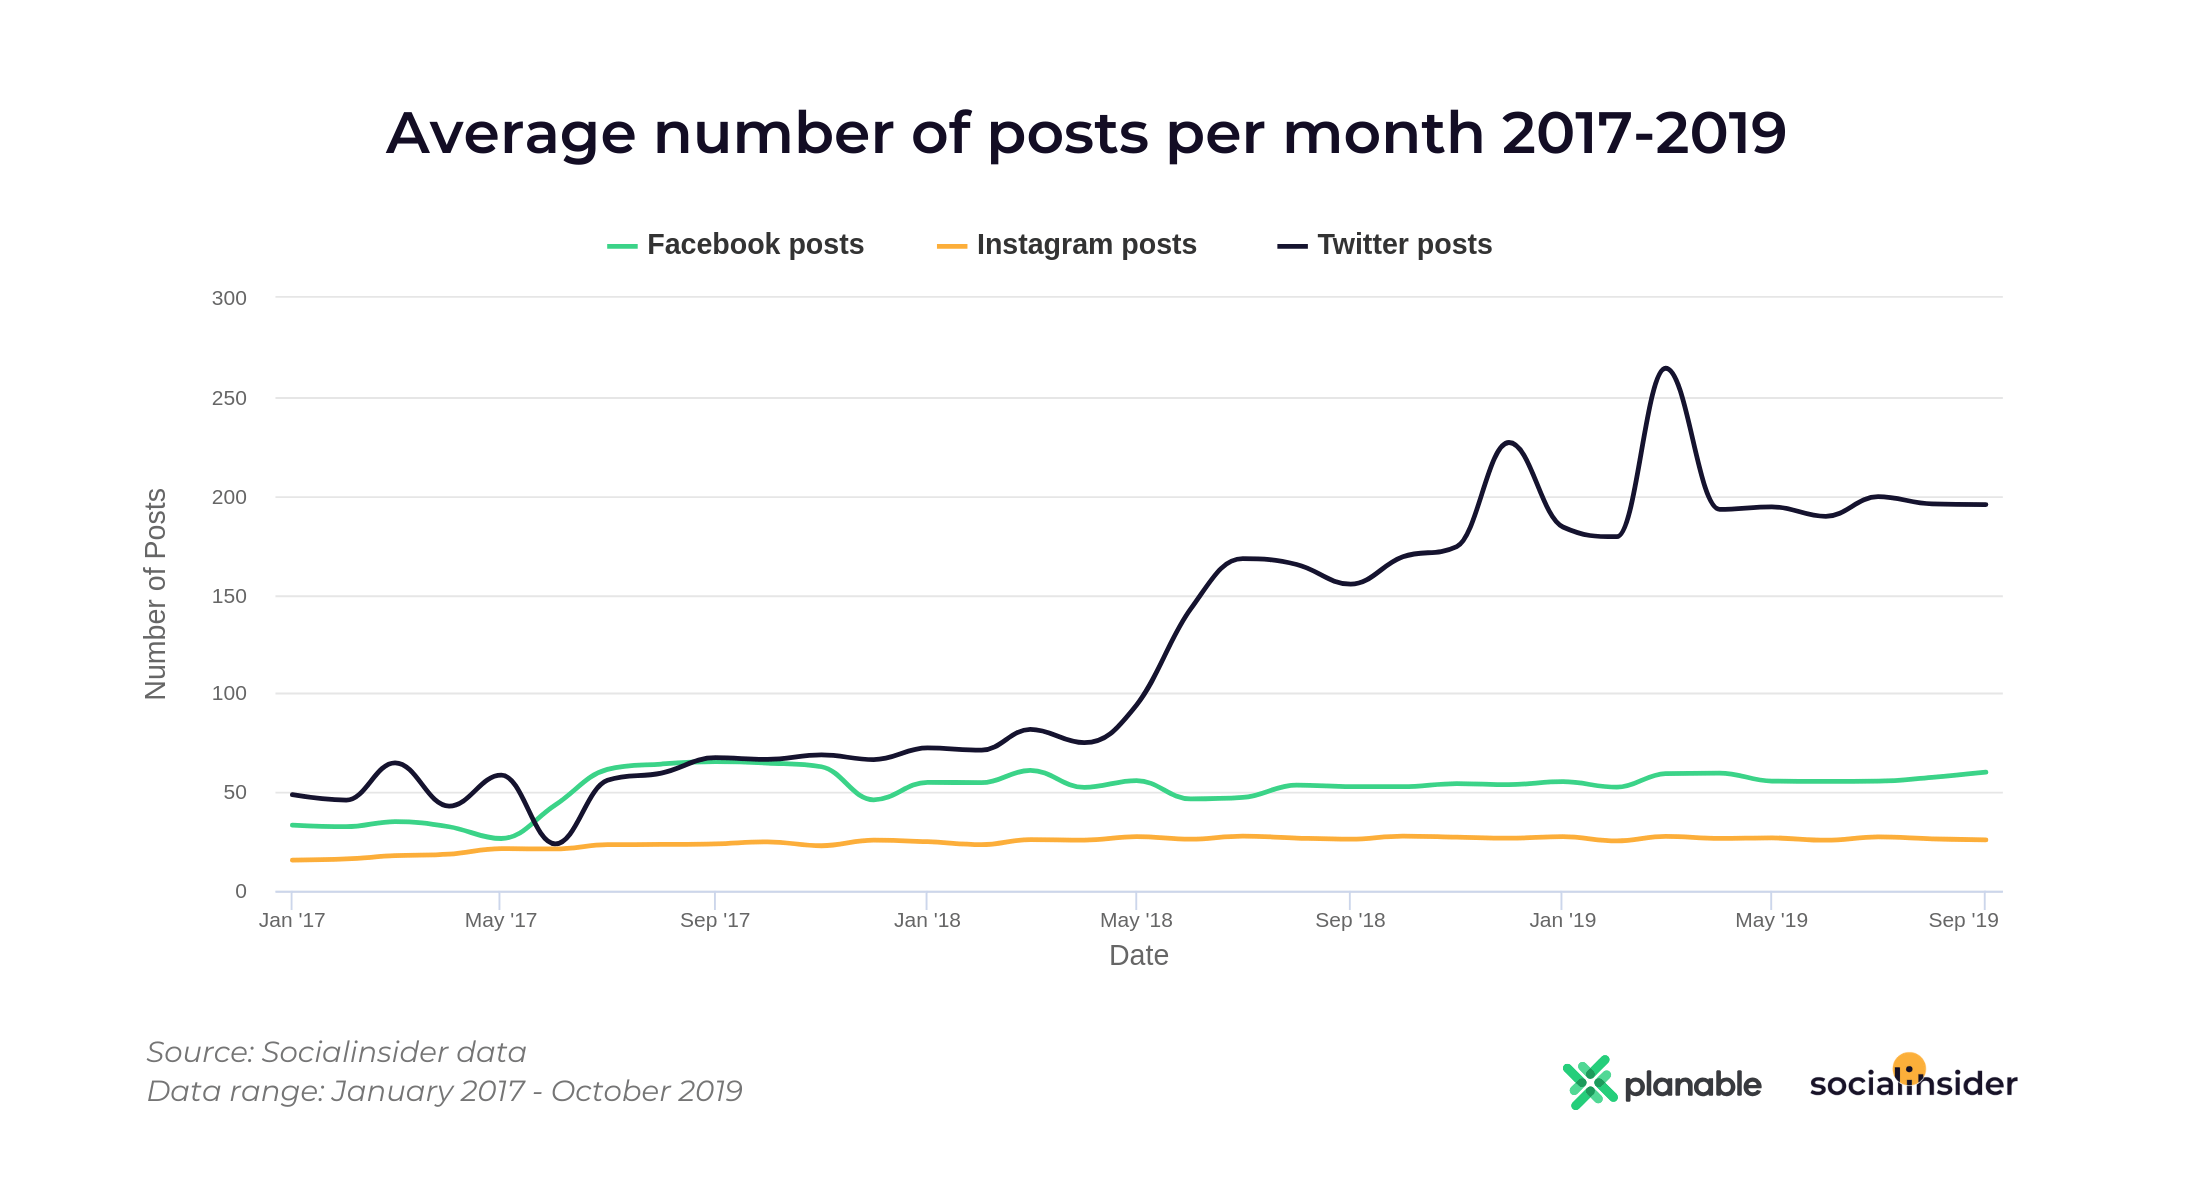
Where are brands most active and vocal. We deep dive into where brands have been choosing to post more and their posting habits from 2017 until the present day.
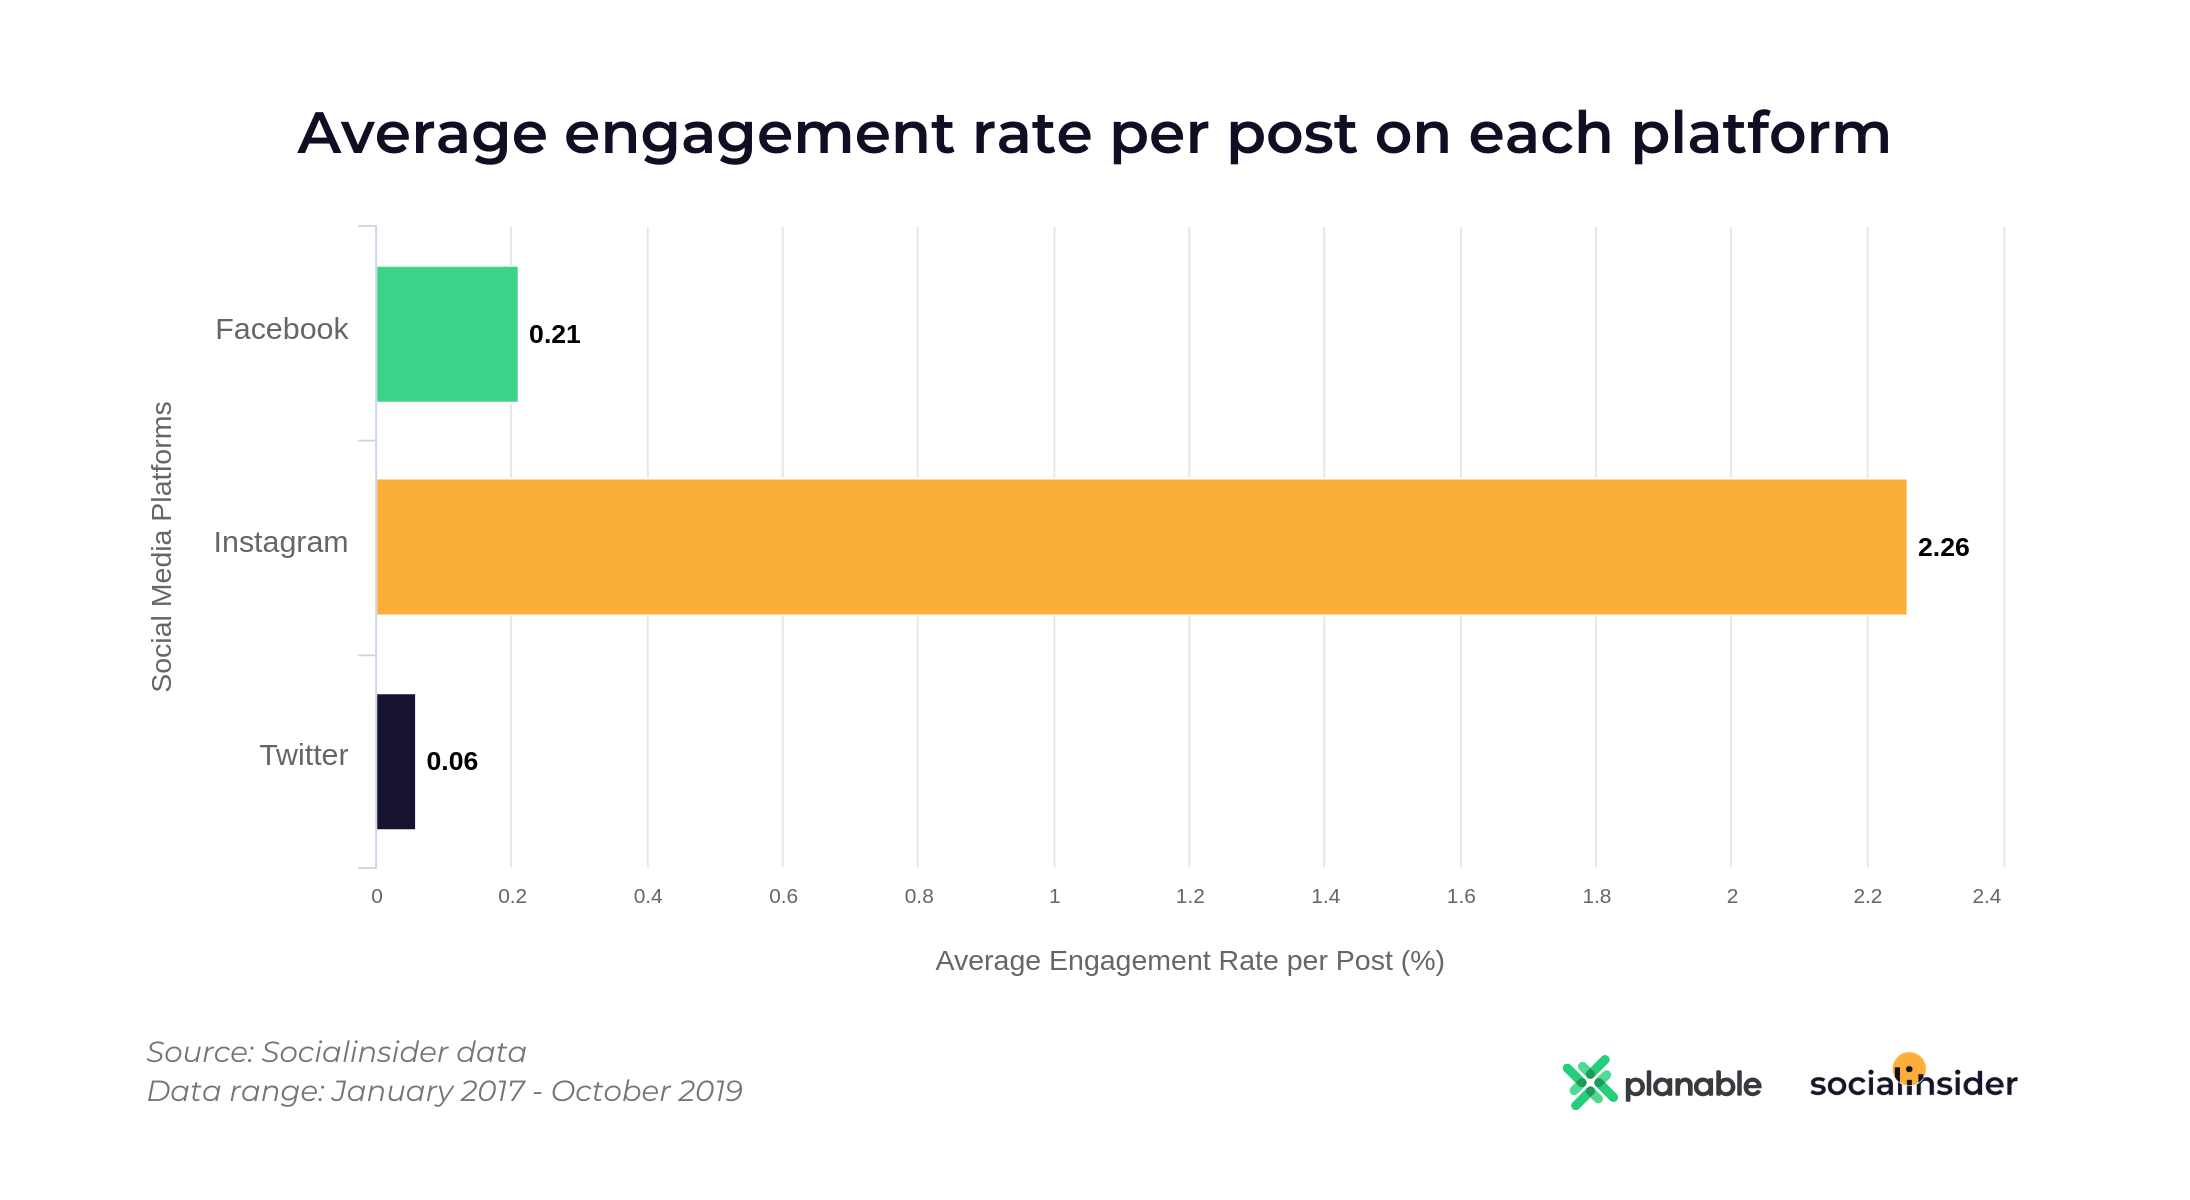
Where’s the highest engagement rate per post – We look at an overall average engagement rate per Facebook post versus Instagram post versus Twitter post to see which platform has a more responsive audience.
What type of post works best on each platform and how long should captions be – We find the perfect combination between the length of the caption and the type of post: images, carrousels/albums, links, statuses, and videos.
What does the perfect post look like on Facebook, Instagram, and Twitter – We identify the combos that bring the highest engagement rates on each of these 3 platforms individually.
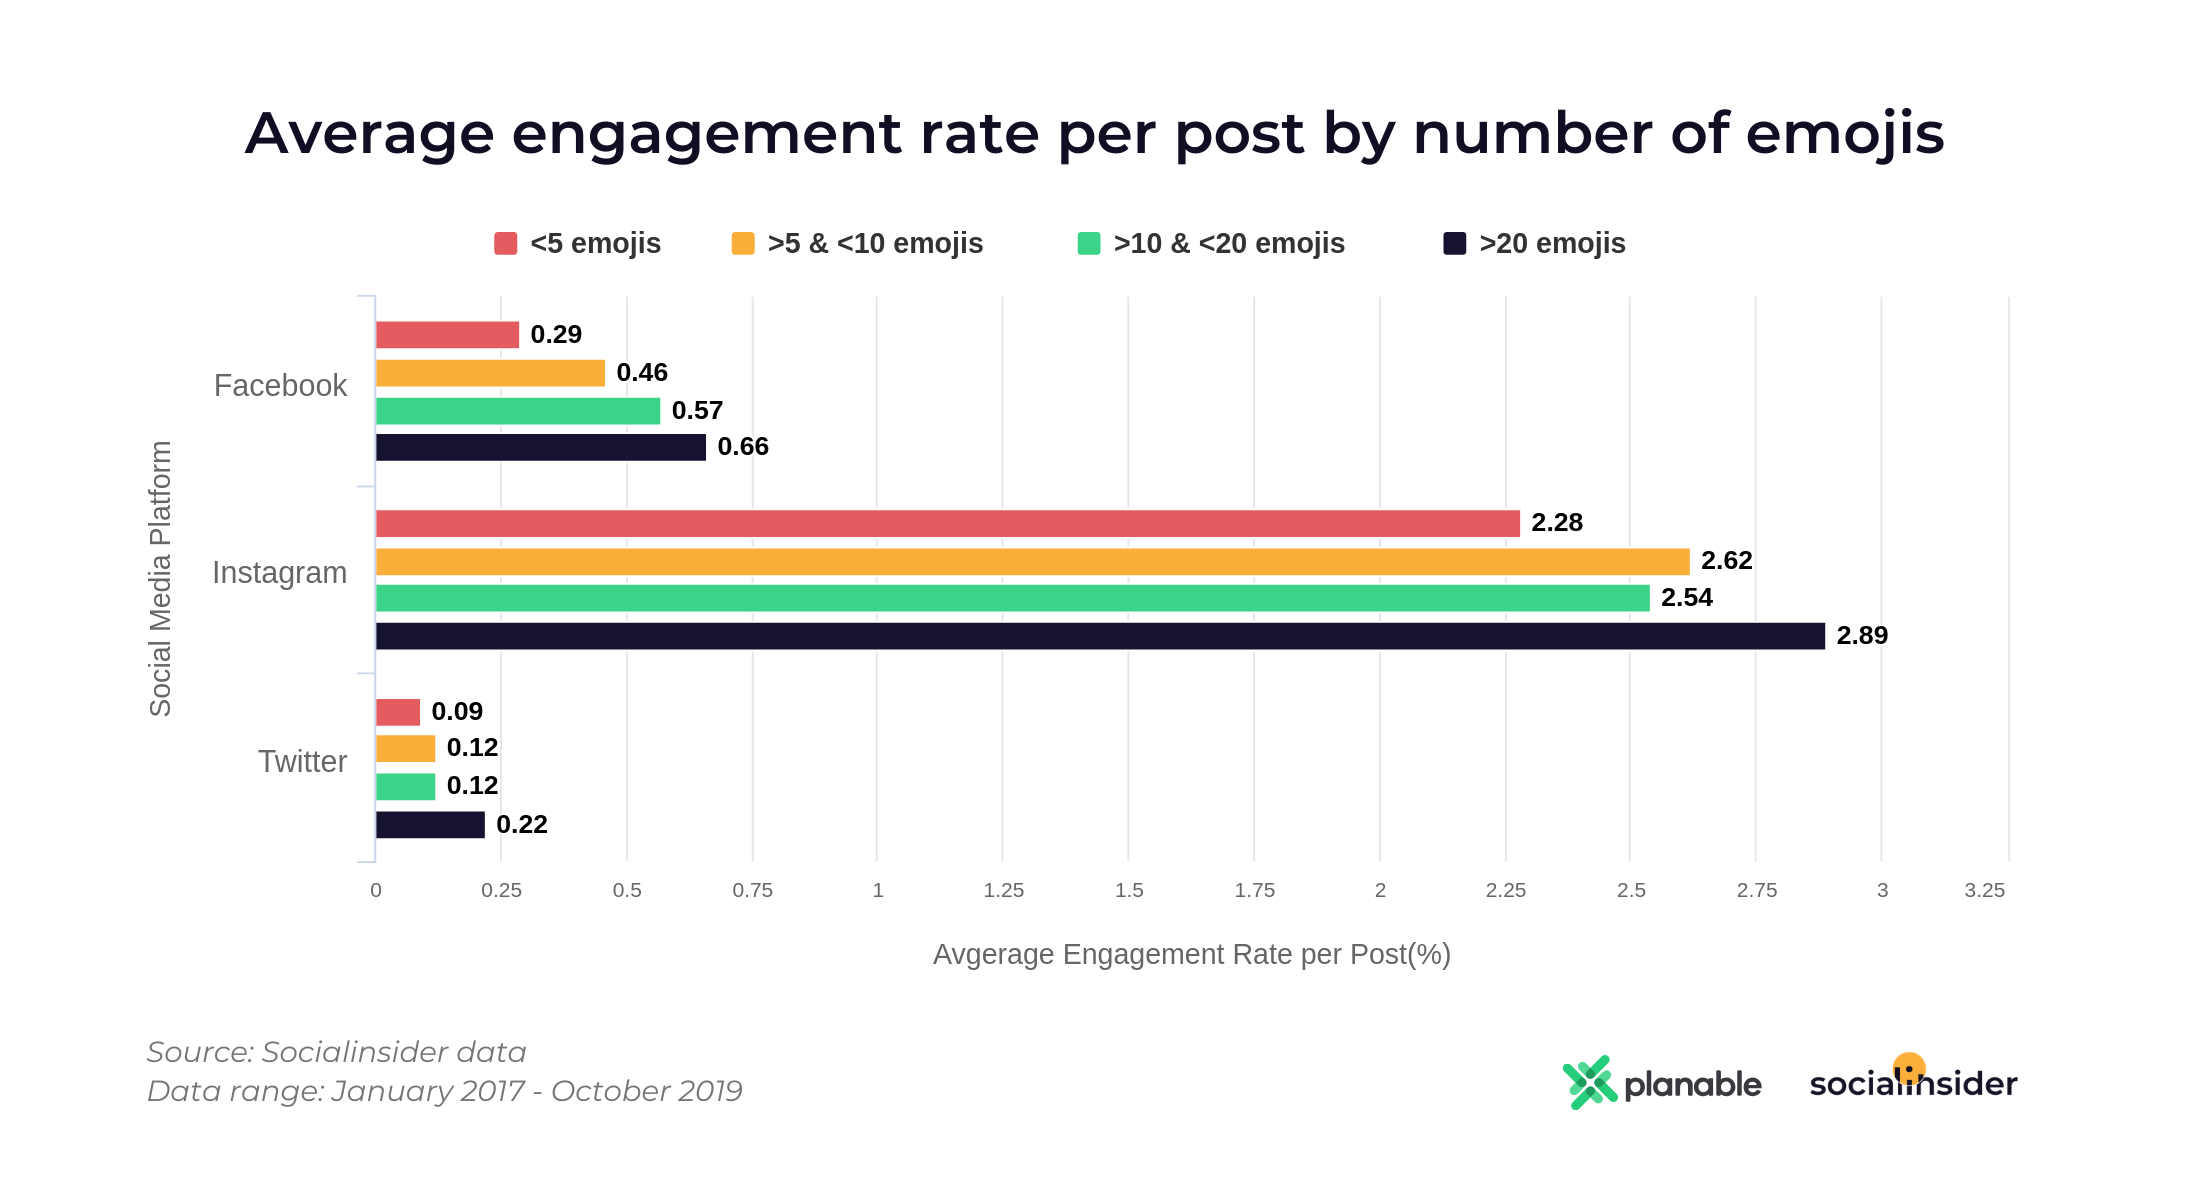
Do emojis influence engagement on Facebook, Instagram or Twitter – We look at how posts that contain emojis perform and what the optimal number of emojis seems to be.
Does asking questions in the caption encourage engagement – We understand if asking questions actually makes your audience answer through comments and likes.
What types of messages raise more interactions – We take a good look at post messages from categories such as promotions, giveaways, tutorials, DIYs, events, contests.
How do holiday posts perform – We understand if Christmas posts bring engagement on Facebook, Instagram or Twitter.
Key findings from the social media captions study
Brands love to interact on Twitter. Brands post, on average, 60 posts per month on Facebook, 25 posts/month on Instagram, and 195 posts/month on Twitter.
Instagram is by far the most engaging platform, with an average engagement rate/post of 2.26%, as opposed to 0.21% on Facebook and only 0.06% on Twitter. Although brands post less on Instagram, this is where the audience is more willing to interact with them.
20.7% of all posts on Facebook, Instagram, and Twitter include emojis in the caption and they have higher engagement rates per post. Across the board, posts with emojis in the caption lead to an increase of engagement in comparison with posts that do not include emojis.
9.8% of all posts on Twitter, Facebook, and Instagram include questions in the caption and it leads to a decrease in engagement. Brands seem to already be aware of the fact that asking questions on social media rarely leads to getting the answers they hoped for.
Perfect posts: over 20 emojis, short captions with albums/carousels or videos. Using over 20 emojis, writing short captions of under 10 words and posting albums/ carousels on Facebook and Instagram, but videos on Twitter results in higher engagement rates per post.
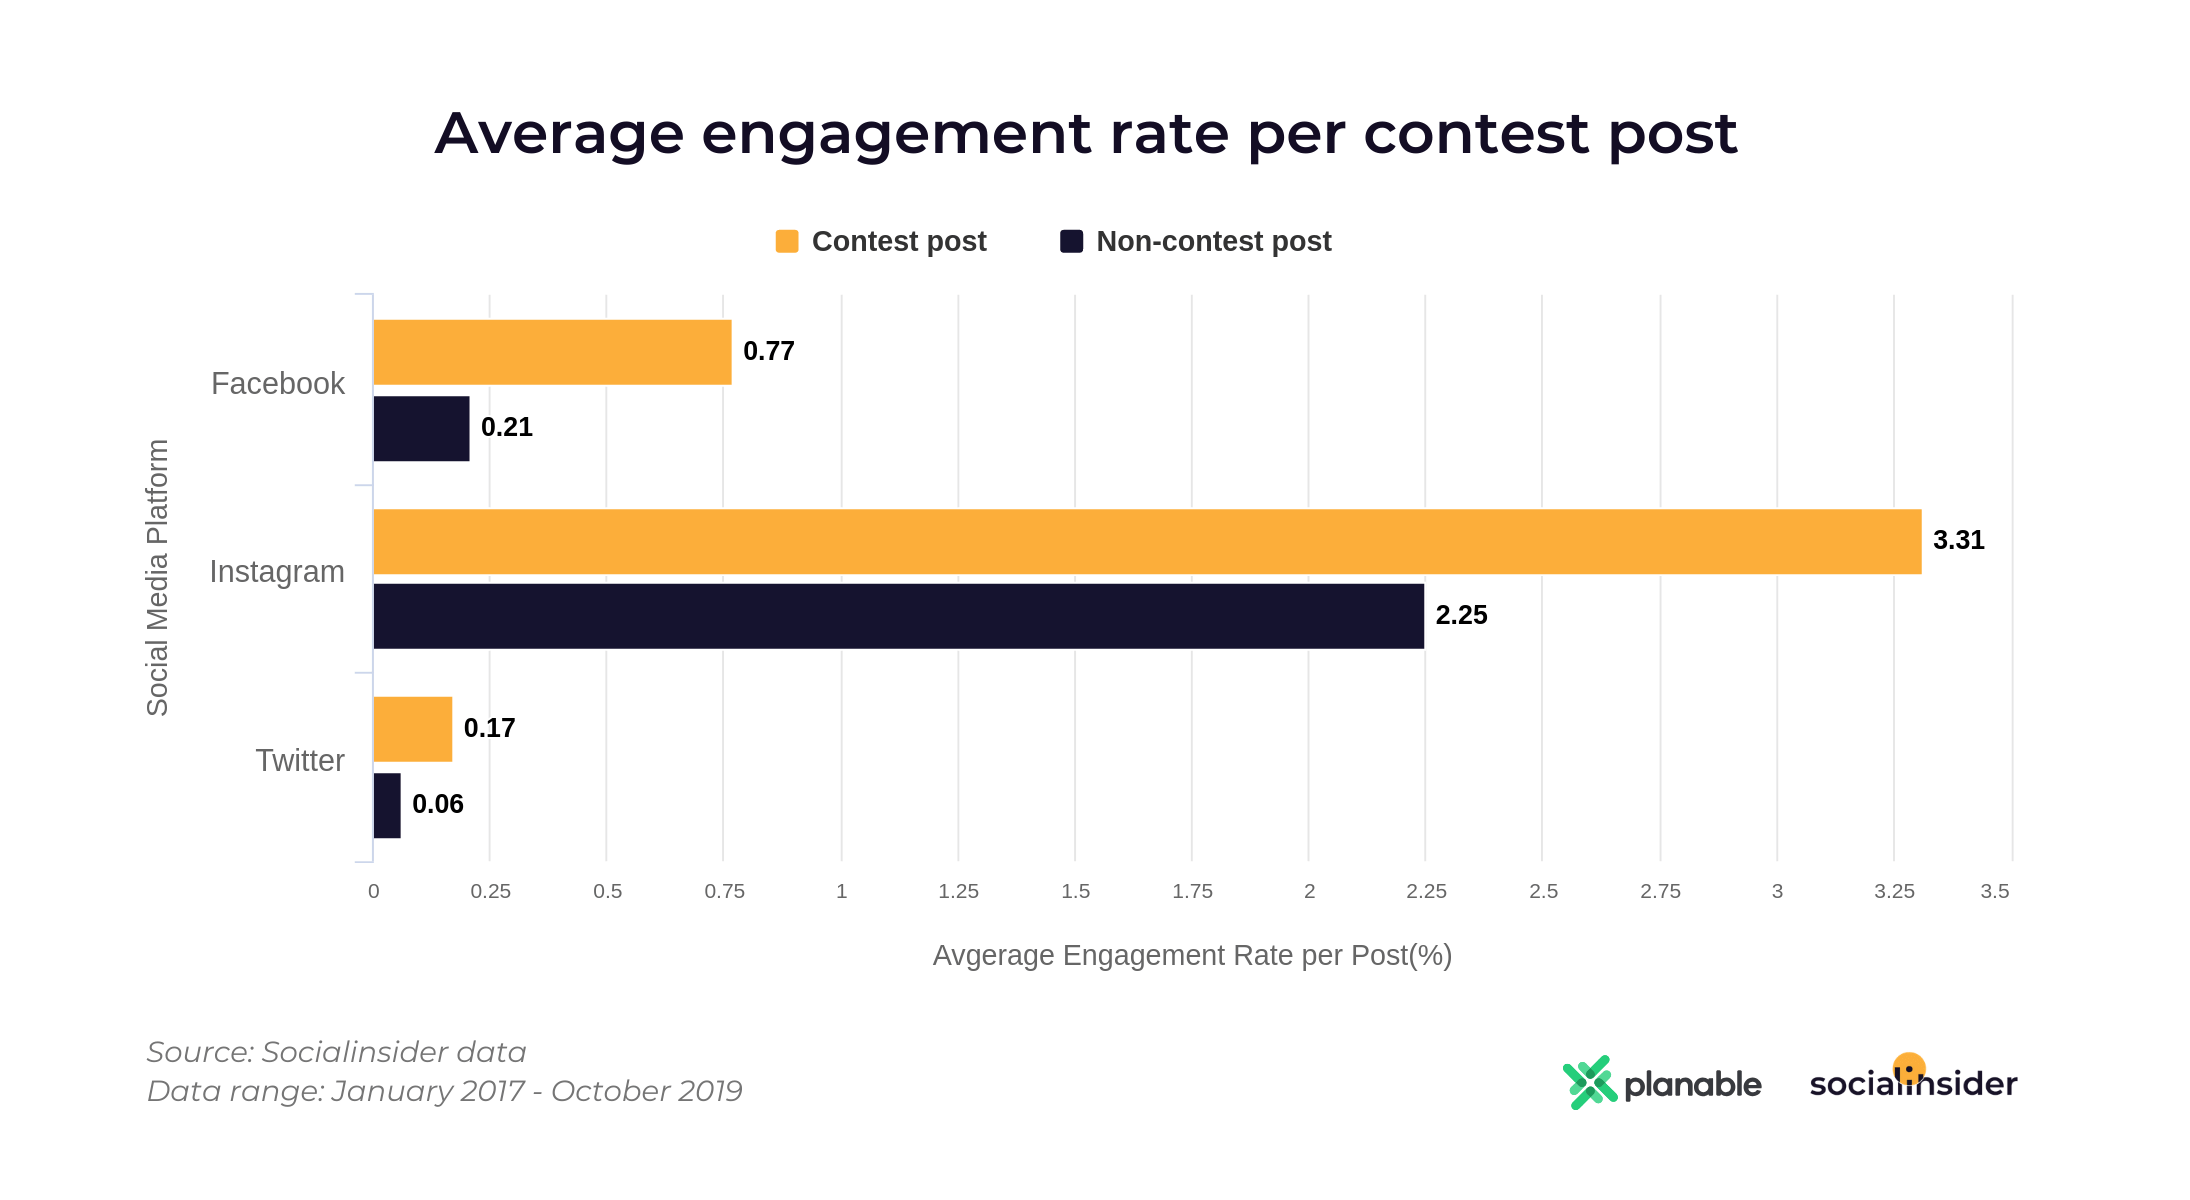
Messages in captions: Posts about contests and giveaway are still top performers. Posts about contests and giveaways perform exceptionally well across the board, bringing higher engagement on all 3 platforms, while tutorial posts perform badly across the board.
Christmas posts only perform well on Facebook – 0.35%. Posts that include Christmas words or Christmas hashtags only have a higher engagement rate than regular posts on Facebook, while on Instagram and Twitter they bring down the engagement.
Miruna Dragomir, CMO @Planable, ex Social Media Comms Manager @Oracle & ex Marketing Coordinator @Uber. 9 years of experience in social media and marketing. Built Planable’s brand and reputation and helped grow it from 50 customers to over 6.5K. Social media fanatic, tech geek & a sucker for learning.