Looking for a way to boost productivity and cut through the chaos of managing multiple clients and creative projects? The right marketing agency project management software might just be your secret weapon. In this guide, we’ve lined up the best project management...
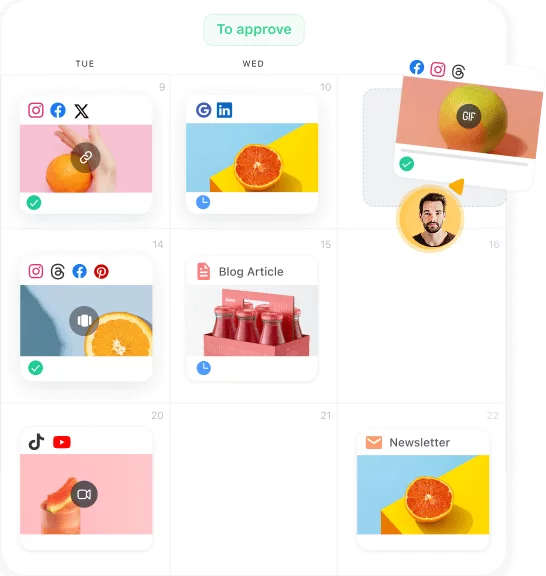
Redesign For multi-location brands
all your locations, one content flow
For multi-brand companies
content collaboration at scale
For agencies
impress your clients and take on more
“The team loved it from the start. Planable helps us overview the entire marketing efforts.“
The state of social media is best understood through the numbers. With more than 5.4 billion people using social platforms and handling an average of 7 apps per month, the industry has never been more complex, or more competitive.
To cut through the noise, we’ve compiled the latest social media statistics from trusted global reports and combined them with Planable’s survey of 1,000 marketers worldwide. Together, these insights reveal how marketers spend their time online, which platforms are gaining ground, and the challenges of managing multiple social media accounts in an increasingly complex landscape.
How many people are using social media in 2026?
In 2025, the question isn’t whether people are on social media, but how many platforms they’re juggling, how much time they’re giving them, and how those habits are reshaping marketing.
The latest social media statistics highlight a global audience that’s still expanding, though growth is slowing in already-connected regions. With billions of monthly active users, the numbers confirm that social platforms remain the backbone of digital life worldwide.
Global social media stats: total users in 2026
The global social media user base keeps growing with billions of people logging in to at least one social media platform every month.
Here’s what the global numbers tell us:
5.41 billion social media users worldwide (July 2025) — about 65.7% of the world’s population.
95.7% of internet users use social monthly (regardless of age).
Among adults, social active users are 88.9% of the 18+ population.
The typical social media user engages with around 6.84 different platforms per month.
5.24 billion people used social at the start of 2025 (63.9% of population).
5.41B figure reconfirmed in the as the latest update in July 2025.
Internet users total about 5.5B+ in 2025, helping lift social adoption further
+241 million new social media user accounts in the past 12 months (+4.7% YoY).
Platform preferences differ by age category: younger audiences gravitate to Instagram, older to Facebook/WhatsApp
Measured by mobile app activity, YouTube has the largest active user base; WhatsApp and Facebook follow.
With 5.4B+ social media users worldwide and most people using 6-7 platforms each month, brands don’t need to be everywhere. Instead, they should double down on the biggest social media platforms their target audience already uses and adapt strategies for each age category.
Social media statistics: time spent on social platforms
How much time are people actually spending on social? The latest social media statistics point to hours per day across age groups, with younger consumers leading the way.
Here’s what the global numbers tell us:
Average daily time on social is 2h 21m. That equates to around 18h 46m per week for the typical user.
Globally, people spend a combined ~14.5 billion hours per day on social. That’s around 1.7 million years of human time every day.
Younger users (16-24) spend 3h+ per day on average; time decreases with age.
Watching online video is a major share of social time (YouTube, TikTok, Instagram Reels).
Multi-platform behavior (6.84 platforms/month) increases total time because usage is spread across different platforms
Reasons for use: entertainment, staying in touch, following creators/brands, and news are top drivers of social media usage.
Talkwalker trend research highlights persistent short-form video consumption and creator content in what users spend hours watching.
Time spent on messaging and group/community features is rising as users engage beyond public feeds.
News and information remain meaningful use cases, with shifting platform preferences among younger audiences.
People now spend nearly 19 hours a week on social. That means there’s more opportunity for discovery, but also more competition for attention. Brands should lean on short-form and high quality video content that matches how people naturally spend their time.
Social is mobile-first. Most active users access their favorite social media platform on smartphones, with desktop playing a secondary role for work-oriented networks and long-form video.
Here’s what the global numbers tell us:
Meta’s tools indicate around 98.5%+ of users access its platforms via mobile devices
There are 5.7B+ mobile phone users worldwide in 2025, underpinning mobile-ledsocial media usage.
Smartphones are the default device for most social media users, across regions and age groups
YouTube and LinkedIn retain a comparatively higher share of desktop/laptop sessions versus mobile-only networks, but mobile still dominates.
The typical user’s 6.84 platforms/month implies a mobile app bundle of social + messaging + video.
Ad reach figures (YouTube 2.54B; Facebook 2.36B; TikTok 1.94B; Instagram 1.88B) demonstrate the mobile-addressable audience at scale.
Creators and short-form video formats are optimized for phone screens first, then repurposed to desktop.
Threads and other emerging platforms launched with mobile-first growth spurts, reflecting current product strategy norms
With 99%+ of users logging in via mobile, every piece of content needs to be mobile-first, with brands now prioritizing social media app development to create seamless mobile experiences. Vertical video, quick messaging, and tap-friendly ad formats will outperform desktop-focused campaigns. Only platforms like LinkedIn and YouTube still hold space for desktop experiences.
Social media statistics on growth trends & user behaviors
Beyond counting social media users, the latest social media statistics show how habits are changing across the digital landscape. People are spending more time across multiple social platforms, experimenting with new formats, and blending entertainment with shopping.
Here’s what the global numbers tell us:
The average user now engages with around 6–7 different platforms per month, showing multi-platform usage is the default.
Short form videos are the dominant format globally, with TikTok and YouTube setting the pace for repeated watch sessions.
Messaging and private communities have grown into core social behaviors, with Facebook Messenger, WhatsApp, and similar apps central to daily usage.
Creating content is rising: Instagram, Snapchat, and TikTok see stronger participation in publishing vs. just passive browsing.
Shopping via social media is mainstream, more than half of users report buying directly through social platforms.
Platform overlap means very few audiences are unique to a single network, making cross-platform strategies critical.
AI recommendations now power most content discovery, with TikTok, YouTube, and Instagram leaning heavily on algorithmic feeds.
Emerging platforms like Threads can surge quickly, showing how user attention shifts when new products meet demand.
Different age groups still favor different behaviors: younger generations are more experimental with video and creators, while older groups focus on messaging and community.
Global audience growth is slowing, but behavioral depth (time spent, formats consumed, number of platforms used) is increasing.
2025 is defined by multi-platform, video-first, commerce-enabled usage. Rather than asking which platform is winning, the real shift is in how people behave: mixing entertainment, communication, and shopping with ease across apps. Brands should focus on short-form video, private conversations, and social commerce experiences that travel across channels.
Which platforms are capturing user attention in 2026?
Social media platform growth continues in 2025, but the way people use each network is changing.
Monthly active user stats for top social platforms: Facebook, YouTube, Instagram, and X.
These social media statistics show that every platform attracts distinct behaviors, from discovery and commerce to community and conversation, marketers need to adapt their strategies accordingly.
Instagram social media statistics
Instagram remains one of the biggest social media platforms in 2025. With more than 2 billion monthly active users, it captures the attention of younger social media users through short videos like Stories, Reels, and creator collaborations.
Essential social media stats for marketers:
Instagram’s ad reach increased by more than 90 million people in 2024, now standing at 1.74 billion.
In the US, 172 million adults use Instagram, which equals around 60% of adults.
The largest age category worldwide is 25–34, and the gender split is fairly even.
Americans spend an average of 33 minutes per day on Instagram, while Gen Z averages nearly an hour.
Instagram is the 4th most visited website in the world, underscoring its role in search and discovery.
More than 200 million businesses use Instagram every month to reach audiences
500 million people watch Instagram Stories daily, making it a key driver of interaction
Marketers should view Instagram as the bridge between entertainment and shopping. Users expect Reels, Stories, and creator collabs to feel native and fun, not like ads. With audience engagement dipping, the key is to prioritize quality interactions. Aim for saves, comments, and shares rather than chasing likes. If you can integrate shoppable posts into authentic content, Instagram can still be your most valuable conversion-friendly social media platform.
Facebook remains a dominant social media platform with over 3 billion monthly active users, making it one of the largest online communities. Despite increased competition from multiple platforms, Facebook is still central for older age groups, family connections, and group-based communities.
What the social media data reveals:
Facebook ads reached 2.28 billion people in January 2025, or about 28% of the global population.
About 72% of US adults use Facebook, translating to 197 million people.
The largest age groups are 25–34 (31%) and 35–44 (22%), showing a more mature user base.
Facebook’s female users aged 65+ made up 3.4% of its global ad audience; males 65+ made up 3.0%.
US adults spend around 31 minutes per day on Facebook, just behind Instagram.
Video remains a core part of Facebook usage, with the platform reporting that daily video views exceed 4 billion globally, keeping it a top format for engagement.
For marketers, Facebook should be their community headquarters. Even though Page engagement rates are modest, Facebook still gives access to the broadest global audience. Lean into Groups, native videos, and community-focused campaigns to build loyalty. If you’re targeting older audiences or multi-generational households, Facebook remains unmatched. The trick is not to post more, but to foster ongoing conversations that keep people coming back.
LinkedIn has become more than a networking site. It’s now a core social media platform for content creation. With over 1.2 billion LinkedIn users, it thrives among young professionals aged 25–34 and is essential for B2B brands.
Key social media stats findings to consider:
In the US, the platform reaches over 250 million members, nearly every working-age adult online.
The US audience grew by 30 million people in the past year, a 13% increase.
LinkedIn ads now reach nearly 92% of working-age US adults.
The biggest global cohort is 25–34-year-olds, who make up 47% of the audience
The gender split is balanced, with 51% men and 49% women.
Engagement rates are lower than consumer platforms, typically under 1%, but every interaction carries professional weight.
Carousels and thought-leadership posts generate higher click-throughs compared to link-only posts.
LinkedIn is no longer just a site for finding jobs, it’s a content platform for professionals. Marketers should focus on building authority content, carousels, and thought-leadership that spark conversations among peers. With almost universal reach among US professionals, this is where employee advocacy and executive voices can elevate your brand. Posting consistently (2–5 times a week) helps maintain visibility.
With nearly 2 billion active users, it’s one of the fastest-growing social platforms among younger people. Entertaining videos, viral trends, and creator content dominate TikTok usage worldwide.
What social media stats you need to know:
In the US, TikTok reaches 49.6% of adults, around 136 million people.
The platform’s ad reach dipped by 8.3% in the US last year, but it’s still expanding globally.
Globally, 42% of TikTok users are aged 18–24, making it the youngest major platform.
The gender split is nearly even, with 51% male and 49% female.
US adults spend about 54 minutes per day on TikTok, more than on any other social platform.
Engagement averages around 2–3%, the highest among major networks.
Entertainment and creator-led videos dominate, accounting for over 70% of top-performing content.
TikTok should be the culture engine for marketers. With users spending nearly an hour a day on the app, attention is high. When marketers ask how to get more views on TikTok, the answer is consistency. Brands that win here: post often, ride trends fast, and collaborate with creators to stay relevant. It’s less about polished ads and more about authentic, entertaining storytelling.
X (formerly Twitter) is still a leading social media platform for real-time updates, news, and political discourse. With more than 580 million active users, it attracts a broad mix of internet users who value immediacy and conversation.
The social media data tells us this:
In the US, about 38% of adults use the platform, with a total of 104 million people.
Globally, the audience is majority male, with 63% men and 37% women.
The main age category is 18–34, making up more than 55% of users.
Americans spend about 30 minutes per day on X, mainly for news and updates.
Engagement rates average just 0.15%, the lowest of the major platforms.
Tweets with visuals and videos can see up to 35% higher engagement than text-only posts.
Real-time events and political discourse remain the top drivers of activity.
X (Twitter) is not where you’ll get massive engagement rates, but it’s where conversations break first. Success here comes from speed, wit, and visual support. Same goes for native video, quick replies, and on-the-spot commentary during live events. If Instagram is for polished content, X is for immediacy and opinion. Use it to showcase brand voice, customer responsiveness, and thought leadership during fast-moving discussions.
YouTube is the largest social media platform by audience reach in 2025. With over 2.5 billion monthly active users, it dominates video content consumption across all age groups and regions.
Important social media stats to know:
In the US, Youtube has 253 million users, nearly every internet-connected adult.
The gender split is 54% male and 46% female, with 25–34-year-olds as the largest group.
Time spent is high, with US adults averaging 49 minutes per day.
Shorts are growing fast, with uploads doubling year over year.
Long-form videosstill generate the majority of watch time and subscriptions.
YouTube is both a search engine and a storytelling platform. Shorts are now really important for discovery, helping new viewers find your brand. The best YouTube Shorts ideas focus on quick tips, behind-the-scenes moments, and trend participation. Long-form videos remain the anchor for trust, loyalty, and education. A winning strategy mixes frequent Shorts for reach with a steady cadence of in-depth long-form content that solves problems or entertains deeply.
Pinterest is a visual-first social media platform with 340 million monthly active users. It is popular among female users and those seeking product discovery.
What these social media stats reveal:
Around 30% of US internet users are on Pinterest.
Women make up about 71% of users, making it one of the most female-skewed platforms.
Most searches are unbranded (96%), showing high openness to new products.
Saves and clicks are the primary forms of engagement, with saves driving repeat exposure.
Product Pins see 2x higher conversion rates compared to standard Pins.
Unlike other platforms, users here come with intent: they’re planning purchases, collecting ideas, and actively searching. Success comes from treating Pins like search-optimized product pages. They need to be keyword-rich, seasonal, and visually compelling. Since most searches are unbranded, even smaller brands can compete if they publish consistently. For retail, fashion, home, or lifestyle, Pinterest offers one of the most direct paths from inspiration to checkout.
Threads is one of the most notable growing platforms in 2025, crossing 320 million monthly active users within months of launch. Its integration with Instagram gives it a built-in advantage for rapid scaling.
Here’s what social media stats stands out:
In the US, around 30 million people use Threads, with numbers still climbing.
The platform’s growth rate made it one of the fastest to hit 100M sign-ups.
Its audience is younger, overlapping with Instagram’s core user base.
Threads frequently ranks among the top downloaded apps worldwide.
Ads are limited, so the current focus is on organic engagement and authenticity.
Threads is still new, but it’s carving out a niche for casual, authentic conversations. Short text posts, quick replies, and lighthearted banter with creators resonate best with active users. Since ads are limited, this is the moment to build organic traction before competition stiffens. Cross-posting on social media through Instagram integration helps keep visibility high, but the tone should stay personal and conversational.
Planable’s social media statistics: how marketers work in 2025
Planable surveyed 1,000 marketers to uncover how teams are managing social media this year, from planning and publishing to performance tracking and AI adoption.
The questions covered key operational areas such as team structure, content cadence, bottlenecks, and tool usage. Their answers reveal valuable insights on how marketing workflows are evolving: what’s working, what’s not, and where teams are investing their time and energy in 2025.
The data offers deeper insights into how today’s marketers engage with social media platforms and adapt to increasing content creation demands.
Team structures & workflows
We asked marketers how their teams are structured and what kind of setup it takes to keep social content flowing. From solo creators to multi-role teams, the data paints a picture of just how lean or complex social media usage can be:
37.5% of marketers manage social media solo.
10.2% work in teams of 7–10 people.
43.9% use just 1–2 tools to manage social workflows.
21.7% juggle 5+ tools.
The fact that almost 40% of marketers manage social media solo highlights how lean many social operations still are. With growing pressure to be present on multiple social platforms, it’s impressive how much gets done with limited resources.
Planning cycles and content volume
Planning habits can say a lot about a team’s resourcing, approach, and structure. So we asked: how far ahead do you typically plan content, and how frequently do you post on average on social media? Here’s what we found out:
38% of marketers only plan 1 week ahead, and another 18% plan 2 weeks out.
20% plan on a monthly cycle, and just 14% look 3+ months ahead.
Posting frequency is spread fairly evenly:
25% post 1–2x/week
23% post 3–4x/week
20% post 5–7x/week
20% post more than once/day
While some marketers stay ahead with clear content planning, many operate on a short fuse. And with 1 in 5 posting daily, users spend more time than ever actively creating content across different platforms.
Platforms and performance
We wanted to understand what “performance” really means for marketers in 2025. So we asked them directly: how do you measure success on social media? The results tell us what metrics teams prioritize when evaluating their strategy:
36% of marketers say they measure success based on engagement (likes, shares, comments).
21% of respondents focus on reach and impressions.
19% track follower growth as a key metric.
Only 15% look at clicks or traffic, suggesting fewer teams are tying social directly to sales or website performance.
As Planable’s social media statistics show, engagement remains the top priority, which reflects a continued focus on community-building and brand awareness over hard performance metrics. For teams wondering how to prove social media ROI, this might indicate a need to better align measurement with broader business goals.
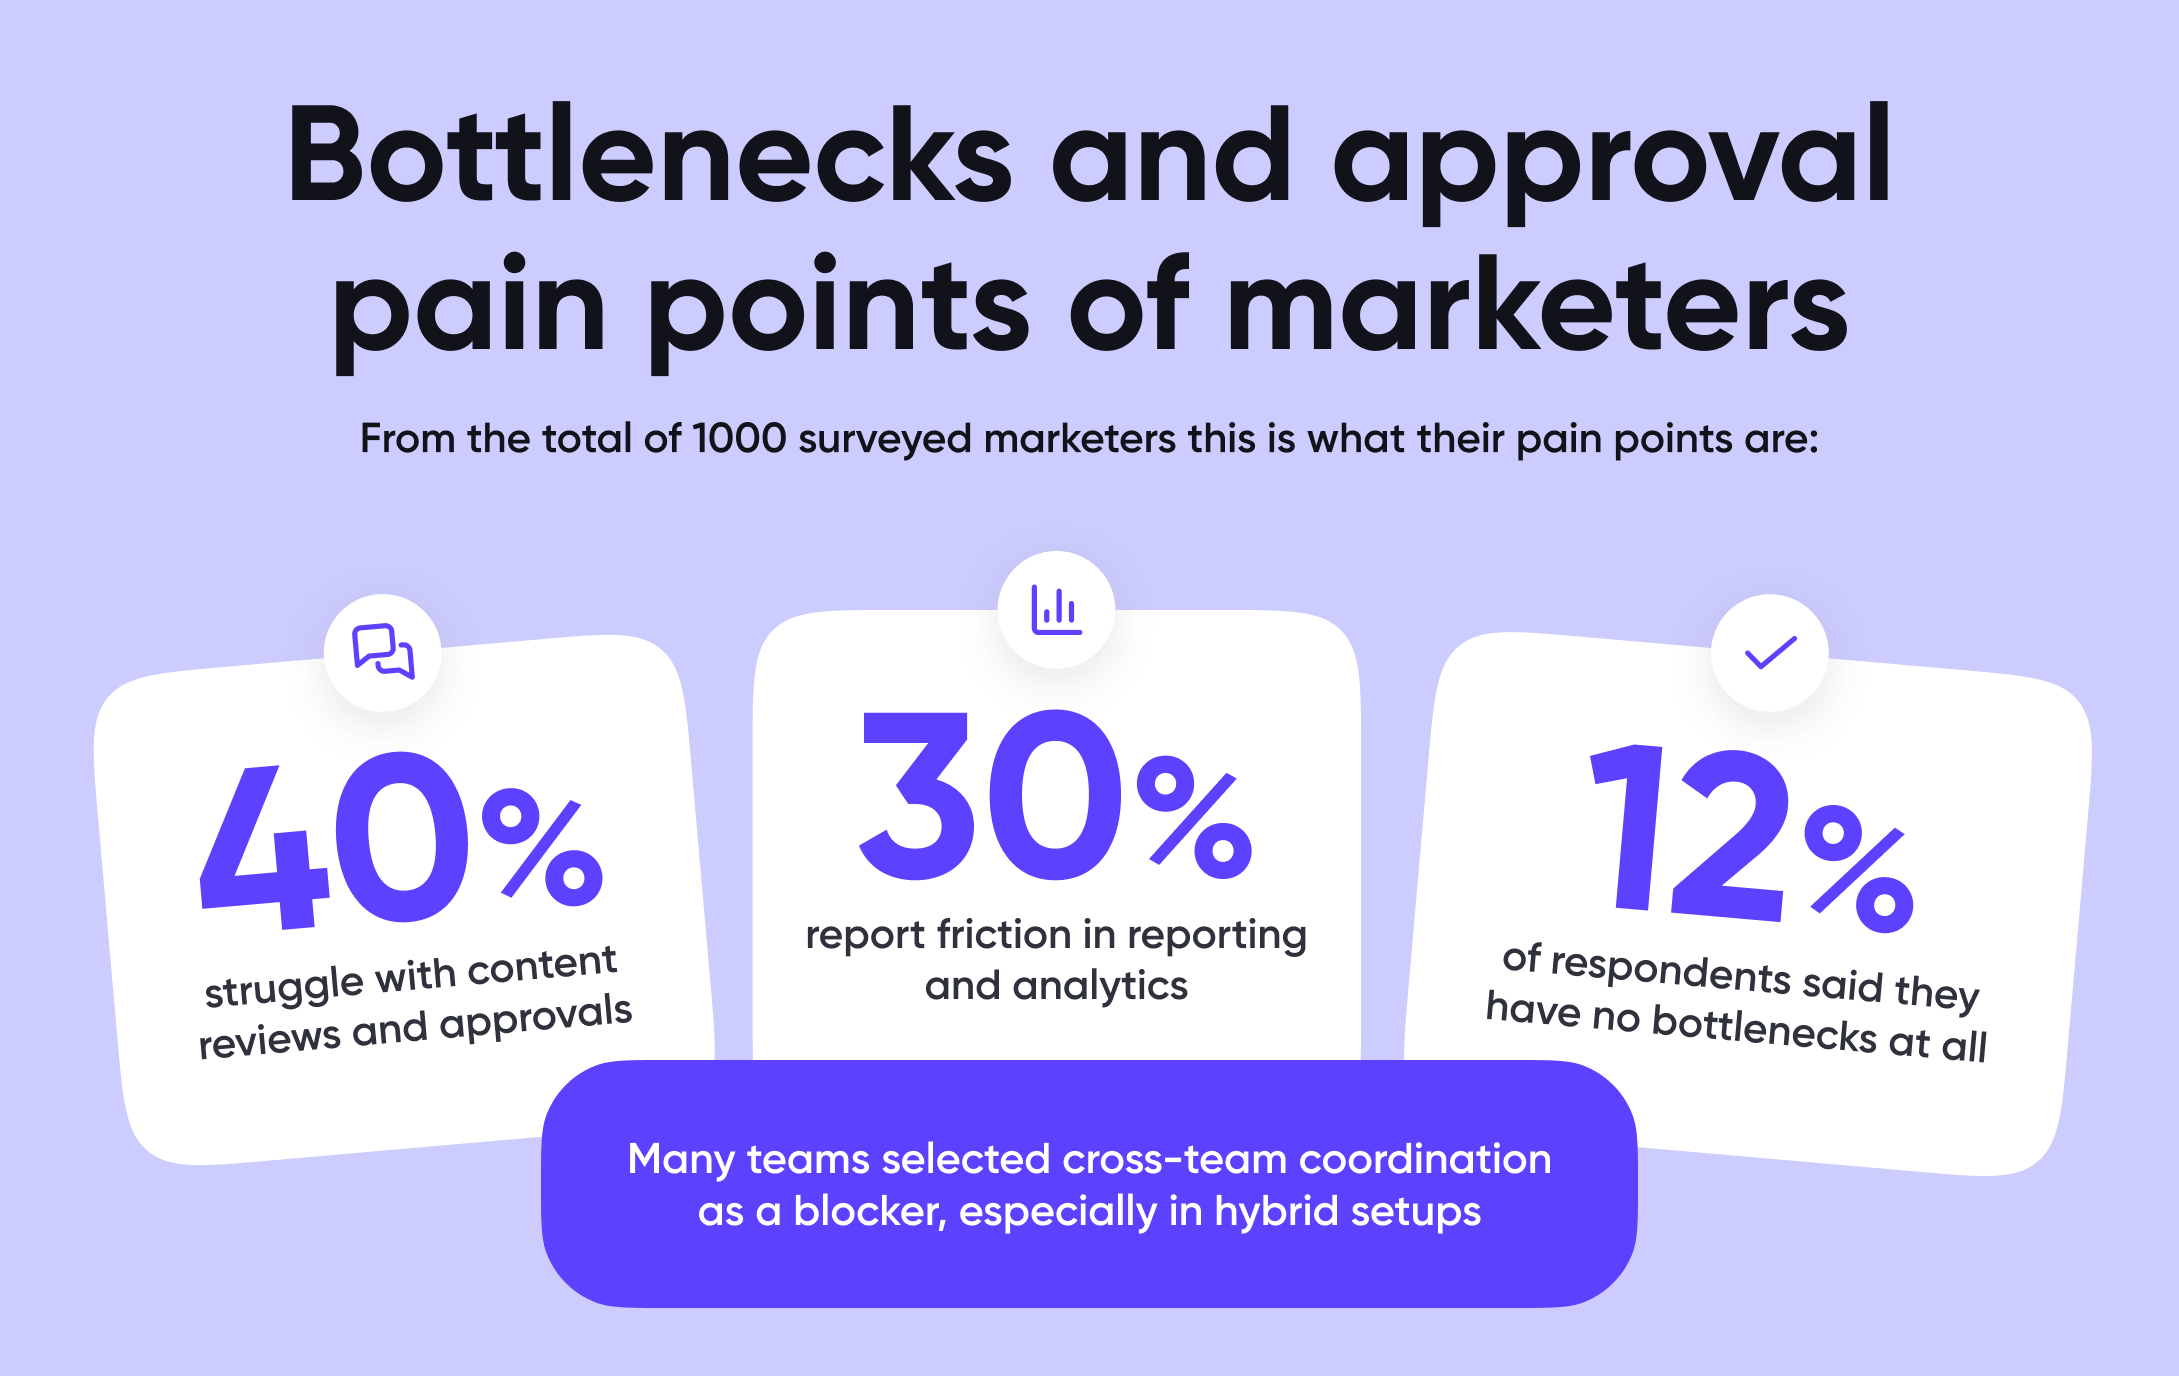
Bottlenecks and approval pain points
Social media workflows involve multiple stakeholders and moving parts. To pinpoint where teams lose the most time, we asked respondents to identify their top process bottlenecks.
What our social media survey data says:
40%+ struggle with content reviews and approvals.
30%+ report friction in reporting and analytics.
Only 12% of respondents said they have no bottlenecks at all.
Content approval workflows continue to be a key inefficiency for marketers. Notably, the number of respondents citing analytics as a bottleneck highlights the difficulty of translating performance into clear insights, especially when data is scattered across platforms.
What types of content perform best?
To find out where marketers invest the most creative energy, we asked: which types of content do you create most often? The answers reveal the formats dominating 2025 workflows:
30% of marketers focus on short-form video (e.g. Reels, TikToks).
29% primarily create text-only posts — quick to produce and often platform-native.
Short-form video still leads, but I didn’t expect text-only posts to be so high. I believe that, when marketers lack design or production bandwidth, they lean into formats that are fast, effective, and easy to scale.
AI usage and automation
To assess the current adoption of AI in day-to-day workflows, we asked marketers to share which tasks they currently use AI for, or plan to explore in the near future.
Key findings in our social media statistics:
35% of marketers are not yet using AI in their social workflows.
Only a small percentage use AI for post scheduling or image creation.
But to better understand how this is evolving, we looked at AI statistics data from a separate AI-focused survey Planable ran with 870 marketers, where we explored deeper attitudes, habits, and concerns.
Here’s what we learned:
Nearly 40% of marketers use AI tools daily, while another 17% use them weekly
70% say AI makes their jobs easier, while just 5% feel it makes their work harder
Top use cases include content creation, repurposing, and automation, but most marketers are still experimenting and haven’t settled into a structured process
48% said their trust in AI depends on the specific tool, and 35% cited privacy and data concerns as their biggest blockers
Surprisingly, only 20% of respondents said their companies had officially implemented AI tools, even though many use them independently
While AI-generated content isn’t yet the norm for everyone, social media marketers are clearly warming up to automation. Most teams are using AI for practical, low-risk tasks like writing, tweaking, or reformatting posts across platforms, not to replace creative work, but to move faster.
In a separate Planable survey focused on AI tools, nearly 60% of marketers reported using AI weekly or more, and the majority said it makes their job easier. It’s not just hype, it’s becoming part of the everyday toolkit.
What’s next: emerging trends and 2026 predictions
The future of social media isn’t about being louder, it’s about being sharper. Marketers who lean on AI for speed, video for discovery, focus on fewer but stronger channels, and embrace platform-specific strategies will be the ones who thrive in 2026:
AI becomes the accelerator.
According to Planable’s survey, nearly 60% of marketers already use AI weekly, and 70% say it makes their work easier. By 2026, AI will handle more execution while humans focus on creativity and strategy.
Video dominates attention.
TikTok users spend almost an hour daily, and YouTube Shorts uploads have doubled. Short-form will keep driving discovery, while long-form builds loyalty.
Platform fragmentation deepens.
The average user now juggles around 7 platforms monthly. Exploding Topics predicts niche and decentralized platforms like BlueSky and Mastodon will attract younger users seeking smaller, authentic spaces.
Strategic simplification takes hold.
Inkbot Design highlights that the “be everywhere” approach is ending. Winning brands in 2026 will double down on 1–2 channels where customers actually make decisions, instead of chasing every new app.
A marketing enthusiast with a deep love for animals and poetry, finding inspiration in the most unexpected places. While she has always enjoyed writing articles, she discovered her true passion for SEO in 2023, a world where creativity meets strategy. Since then, every day brings her new lessons and opportunities to blend the art of words with the science of algorithms.