Looking for a way to boost productivity and cut through the chaos of managing multiple clients and creative projects? The right marketing agency project management software might just be your secret weapon. In this guide, we’ve lined up the best project management...
Redesign For multi-location brands
all your locations, one content flow
For multi-brand companies
content collaboration at scale
For agencies
impress your clients and take on more
“The team loved it from the start. Planable helps us overview the entire marketing efforts.“
Think back to the last post you published or campaign you launched. You probably spent hours perfecting the caption, choosing the right visuals, and timing it just right.
The results? All over the place.
I’ve been exactly where you are. Over my 5+ years in social marketing, I’ve managed more accounts than I can count. And I know how disappointing numbers stung. But what really got to me? Not knowing what was actually moving the needle.
That’s when I made a shift: I started treating content as experiments. This is what helped me grow my Grad Girl Marketing community to 400K+ and partner with 70+ brands:
Every post you publish is an experiment with a hypothesis.
Every metric you track is a data point that tells you something.
Every strategy is a library of evidence about what moves your audience.
Why do I believe in this mindset? Because predictions eliminate randomness. Tests reduce risk. Patterns reveal strategy.
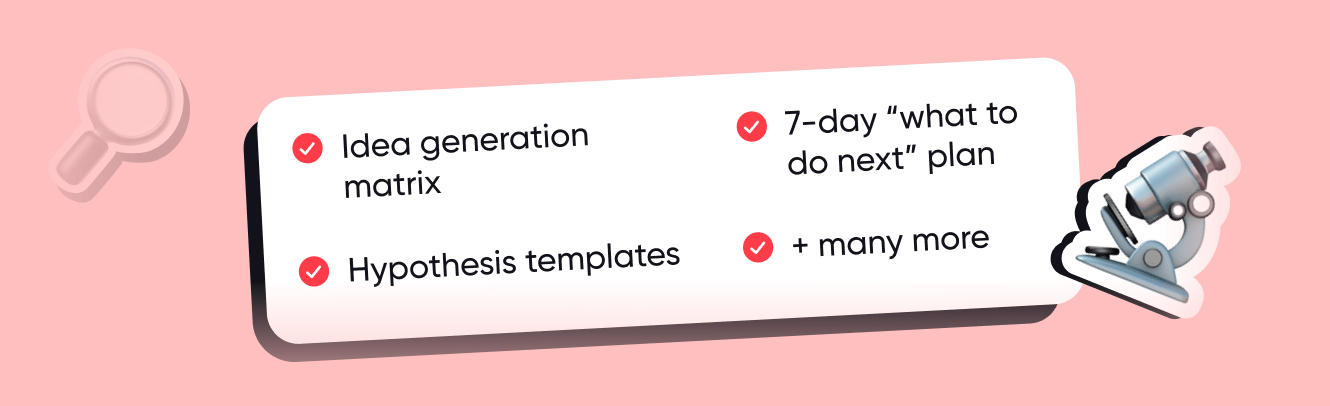
This transformed into a 7-step experimentation process I now follow. And I’m going to share it with you, along with frameworks and checklists, so you can test this approach yourself.
Get the free social experimentation kit 👇
The 7-step framework I use to test social content
Step 1: Collect experiment ideas (hint: you already have them)
Here’s what I like about content experiment planning: you never start from zero.
You’ve got nine content experiment sources constantly running in the background, feeding you ideas. Think of these as your content testing pipelines, places where experiment ideas naturally emerge from what’s already happening in your business and industry.
Audience pains & desires
What keeps your audience up at night? What goals are they chasing? Each pain point becomes a hypothesis. If you address this specific frustration, engagement might increase because it hits what they actually care about.
Repeated customer questions
Questions your support team gets are potential content experiments. Test different formats for answering them. Does a quick video perform better than a carousel? Do people prefer step-by-step tutorials or conceptual explanations?
Industry myths & misconceptions
Myth-busting content works because people love learning something surprising. You can test different angles here: Do dramatic hooks about doing things wrong perform better than gentle corrections? Does humor lower resistance to being corrected? Spoiler: it does. Planable’s Social Media Manager, George Danaila, tested this himself:
Humor was the thing. It consistently stopped the scroll long enough for the core message to land. It created instant attention, lowered resistance, boosted engagement, and quickly became an important part of our content strategy.
Well-performing competitor content
What topics are competitors covering that get engagement? More importantly, what are they missing? Use their content as signals for what your shared audience cares about, then test your unique angle.
Misunderstood product strengths
There’s a gap between what you think is valuable and what customers actually understand. Test different ways to bridge that understanding gap: before/after comparisons, time-saving calculators, customer stories.
Behind-the-scenes processes
People are curious about the mechanics behind products they use. You can test different formats here: Does polished behind-the-scenes content perform better than raw, unedited clips? Do people engage more with process explanations or outcome reveals?
Unpopular opinions and experimental topics
If everyone in your industry says one thing, and you have evidence to say the opposite, that’s your experiment. Test it. You’ll probably see that safe content keeps your current audience, but risky content, though, attracts new ones. That’s what Planable’s SMM, George, learned from running hundreds of content experiments:
Experimental topics attracted new audiences faster than safe ones. Sometimes the posts I was least sure about pulled the most non-follower reach, meaning riskier angles were better for growth.
Lifestyle & context content
If you sell running shoes, test content about training plans, injury prevention, or race day preparation. See if this broader context builds more engagement than product-focused content. Sometimes the adjacent topics outperform direct pitches.
Format-first inspiration
Carousel template trending? A sound going viral? A format everywhere? These are experiment opportunities. Plug your message into a format that’s already proven to capture attention. Test whether the format carries your content better than your usual approach.
But ideas alone are not enough. You need to turn them into testable hypotheses.
Step 2: Turn ideas into testable predictions with my formula
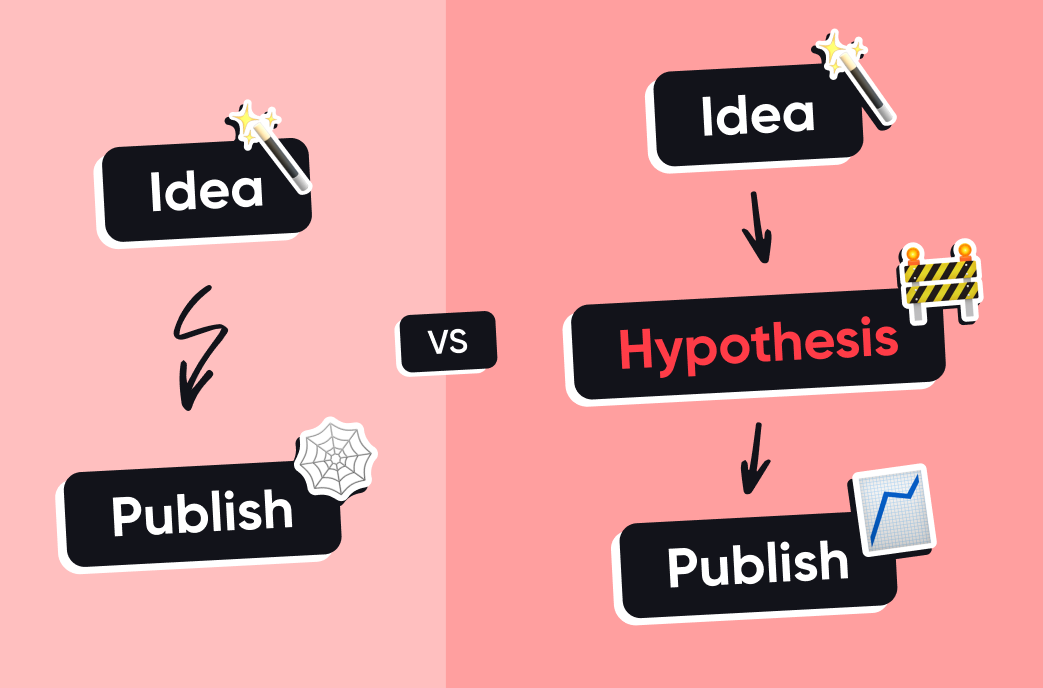
Most social teams skip this step and go straight from idea to production to hitting publish and crossing their fingers.
But here’s what I learned: experimentation needs a middle layer. You need a specific, testable hypothesis about what will happen and why.
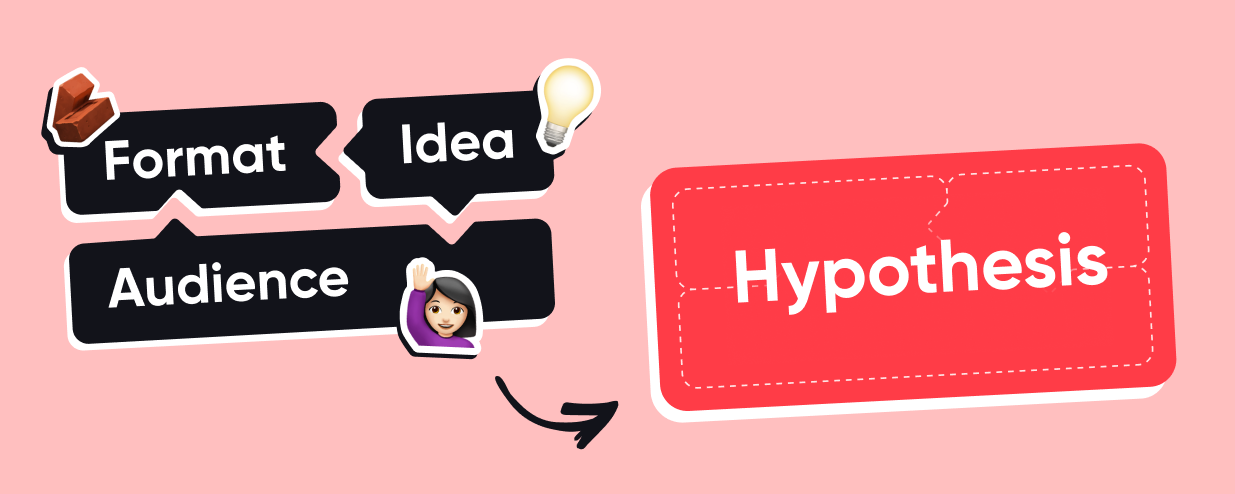
The formula I use:
If we post [format + idea] for [audience], then [specific metric] will increase because [reason rooted in insight].
Let me break down each piece:
Format + Idea: This is the container and the content. Format is your delivery (Reel, carousel, Story, text post). The idea is what you’re actually saying. You need both.
Audience: Who is this for? The more specific you get, the better you can evaluate whether your hypothesis was right. Hypotheses fail when they assume everyone reacts the same way.
Specific metric: What number should move? Saves, shares, comments, profile visits, watch time? Pick one core metric and one secondary. This is how you’ll measure success.
🚨Important! Map intent to a specific metric because optimizing for everything is optimizing for nothing.
If your goal is awareness (getting discovered by new people), track reach and impressions.
If your goal is authority (being seen as an expert), track saves, shares, and profile visits.
If your goal is engagement (starting conversations), track comments, watch time, and likes.
If your goal is conversion-adjacent outcomes, track DMs, link clicks, and signups.
Reason rooted in insight: This is your because. Why should this work? What do you know about your audience that makes you think this will resonate?
Spot the difference:
Weak hypothesis: Let’s try Reels about the industry. Our audience might like it.
This tells you nothing. What should the Reel be about? Who’s it for? What metric should improve? Why should it work?
Strong hypothesis: If we post 15-second myth-busting Reels targeting social media managers, saves will increase because this audience values quick, actionable corrections they can reference later.
Now you have everything: format (15-second Reels), idea (myth-busting), audience (social media managers), predicted metric (saves), and reasoning (they value reference material).
Another example.
Weak hypothesis: Let’s try thought leadership on LinkedIn.
Strong hypothesis:If we share founder POV hot takes on AI content for marketing directors on LinkedIn, shares will increase because people signal expertise by sharing contrarian views in their networks.
Get the free social experimentation kit 👇
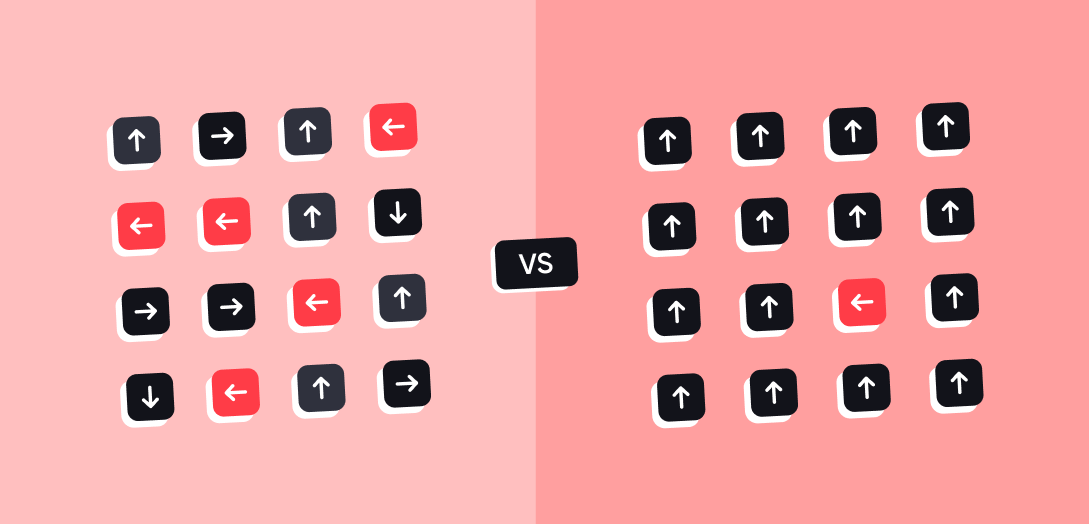
Step 3: Control variables, or you’ll learn nothing
A good experiment is controlled, simple, and deliberate. It isolates the element you want to learn from so you can actually attribute the outcome to a single cause. Change everything at once, and you won’t know what worked or what flopped.
Here are the 5 variables I focus on:
Format. Same idea delivered via carousel, Reel, static post, Story, long-form video, or text post = different results. I test one format at a time to see what my audience prefers.
Hook. The first 1.5 seconds of video or the opening line of text. This stops the scroll, or it doesn’t. You can test question hooks vs. bold claims vs. pattern interrupts with the same core content to isolate what’s actually working.
Delivery. How you package the message: POV monologue, story, tutorial, demo, raw clip, polished edit. A behind-the-scenes idea delivered raw hits differently than polished one. Test delivery change to see what your audience trusts more.
Distribution. Where and how your post reaches people: organic only vs. boosted, Instagram vs. TikTok vs. LinkedIn, posting time. Same content performs differently across platforms.
CTA. What you want your viewers to do: comment, save, share, DM, or click. Different CTAs lead to different behaviors. You can even test if the CTA is really needed. Here’s what George at Planable learned:
Not every post needs a CTA. People have had enough of ‘click the link,’ ‘tag a friend,’ or ‘share this post.’ I found that forcing a CTA too often actually hurts performance. Sometimes the most effective posts were the ones that simply delivered value and let the audience engage naturally.
My golden rule is to isolate one variable at a time.
If you change the format AND the hook AND the platform simultaneously, you won’t know what caused the results. Was it the topic that failed or the packaging? Was the idea good with the wrong format? Does this concept work only on specific platforms? With variable control, you can diagnose the problem.
Step 4: Run clean tests, or your data would mean nothing
After running hundreds of experiments, I know that to get results you can actually learn from, you need clean execution. This requires discipline around timing, volume, and process.
Here’s my testing protocol:
Set a testing window. I usually go for 2-4 weeks for comprehensive tests, 1-2 weeks for quick format validation. Too short, and I won’t have enough data. Too long, and market conditions change, or the algorithm shifts.
Set a batch size. 10-30 experiments for longer windows, 3-5 posts for shorter sprints. I adjust based on context because testing a new format usually requires less volume, while testing a new platform needs more, as audience behavior varies more.
Don’t tweak after publishing. Once it’s live, I leave it alone. Editing the caption, swapping the image, or changing copy mid-flight undermines data.
Keep visual identity consistent. I don’t change brand colors, fonts, or graphic style mid-test. Sudden visual shifts create friction and muddy experiment results.
Run multiple tests per hypothesis. One successful post could be luck. Three successful posts suggest a pattern. If you’re testing whether myth-busting drives saves, post three different myth-busting pieces. If all three perform well, scale it. If only one works, dig into what made that one different.
These rules might feel rigid. But when you follow protocol, you can confidently say this format works instead of maybe this format works but we also changed three other things so who knows.
Step 5: Analyze experiments without losing your mind
This is the most challenging part for me, and I guess for most social media managers. Analytics can overwhelm you with too many numbers or leave you lost because you don’t know what matters. The way through is to cut through the noise.
Go back to your hypothesis. You already defined your primary and secondary metrics when you created your hypothesis (Step 2). Don’t get distracted by every number in your analytics dashboard. Focus on what you predicted would increase.
After my testing window closes, I analyze each experiment. I use Planable analytics for this entire step because opening five platform dashboards to compare performance was killing me.
Here’s what I check:
Did the primary metric move as predicted? Let’s say your hypothesis said comments would increase. Did they? By how much vs. baseline? I usually go to the Content section in Planable’s cross-analytics dashboard. There, I can see the metrics I picked for my particular experiment for each post across platforms and how they changed.
What part actually worked? I open posts to analyse what worked. Was it the hook? The topic? The format? I break it down to isolate what drove performance.
Any surprising metrics increase? Your goal was saves and comments, but shares exploded. Why? Surprises reveal insights you didn’t predict and teach you about audience motivations beyond your original hypothesis. Planable shows a lot of metrics with historical trends, so you can easily spot such surprising spikes.
Was performance consistent across variants? If you ran three similar posts, did all three perform similarly? I compare them side-by-side in the Content view. All three myth-busting posts got high saves? That’s a signal. Only one performed? I need more data.
Does this work on all platforms or just some? This is where Planable’s analytics by platform is super handy. I can see if a format crushes on Instagram but dies on LinkedIn. That tells me where to scale it and where to try something else.
There are some things you can check during the first few hours after posting. This can still tell you something, though not everything. Find out how I read early signals vs. noise in the free kit.
Step 6: Decide what to scale, iterate, or kill
After running and analyzing experiments, sort experiments into three buckets: winners, near-misses, and dead ends. Here’s how I do it:
Bucket 1: Proven winners
What qualifies: Consistently outperformed on your target metric across multiple posts (not just one lucky post). This format, topic, or approach works for your audience.
The thresholds I use:
Beats your baseline on 2 metrics (primary and secondary)
Performs consistently across at least 3 posts
Audience response is clearly positive (quality of comments, saves, shares)
~20-30% uplift vs. baseline
What to do: Scale these. Make them a regular part of your content mix. These go directly into your official strategy.
Bucket 2: Near-misses
What qualifies: Something worked (maybe the topic resonated), but something didn’t (maybe the format felt wrong). There’s potential here, but it needs refinement.
The thresholds I use:
Results are mixed (one metric up, another flat)
The idea feels promising, but needs a new hook, pacing, or angle
Got attention, but retention dropped, or vice versa
Small uplift (5-15%) or inconsistent patterns
What to do: Iterate and retest. Change ONE variable and try again. This is where teams often give up too soon; you shouldn’t.
Bucket 3: Dead experiments
What qualifies: Didn’t validate the hypothesis, even after iteration. This approach doesn’t work for your audience right now.
The thresholds I use:
Underperforms multiple times in a row
Engagement rate clearly and repeatedly below baseline
The effort required isn’t worth the return
Consistently below baseline with no improving trend
What to do: Drop it. Don’t force it. It’s okay to kill experiments. Don’t waste your time here; better think of another experiment.
My simple decision rule:
If it clearly wins → scale.
If it shows mixed signals → iterate.
If it drags down your averages → kill.
Step 7: Create an evidence-based playbook with strategies you can repeat
Create a library of tested, evidence-based patterns that actually move your metrics. This should include:
Content pillars based on validated experiments, not wishful thinking.
Repeatable formats like specific structures and hooks that consistently perform
How often to publish each pillar and format based on what the data supports
Which platforms get which content, informed by where each content type performs best
The brand personality elements, tones, and approaches that your tests proved resonate
This will help you move from we should post educational carousels because education provides value to educational carousels with myth-busting hooks increase saves by 28% on average across 12 tests. Post these twice weekly on Instagram and LinkedIn.
Here’s how this played out for Planable.
George and the team ran experiments testing creative, personality-led videos against purely educational content. The hypothesis was that educational content would perform well because it delivers clear value. But after running multiple tests over several weeks, the data told a different story:
The real surprise was how much better creative, personality-led videos performed over time compared to purely educational posts. Creative formats kept compounding: stronger repeat engagement, more non-follower reach, and better long-term retention. Educational content tended to be more niche and didn’t consistently match the audience’s appetite. That insight shaped our content strategy: We didn’t abandon educational content, but we made creative, personality-driven content our foundation.
As you run more experiments and discover new patterns, add them to your playbook. Your strategy improved as your evidence base grows.
Keep the flywheel running
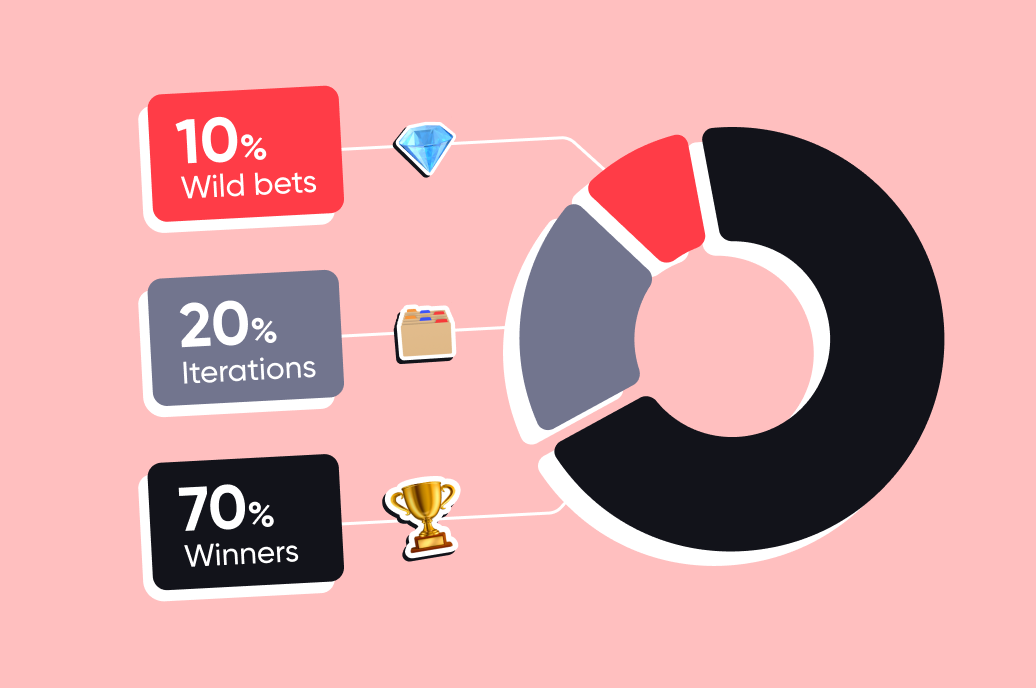
Never stop experimenting cycles because your winners won’t work forever. Here’s the distribution I aim for:
70% proven winners keep your machine running. You know these formats, topics, and approaches work, so you deploy them consistently. This is your foundation. But watch for declining performance over time. When you see it, run new experiments to find the next generation.
20% evolutions take your near-misses and promising ideas and iterate them. You tweak to find even better versions. This is active improvement. Test whether you can take something good and make it great.
10% wild experiments test completely new ideas, formats, or angles. This feeds your future. These are risky, but a few will become your next proven winners.
You’ve seen the framework. You understand the mindset. You know the seven steps. Now it’s time to test. But first, grab my free kit with all the templates, checklists, and tracking sheets you’ll need to run your first experiment cycle.
I started Grad Girl Marketing in 2020 to build the go-to global community for marketers who love what they do. Every Monday I drop my top 5 campaigns, host buzzing London networking events, collaborate with brands on killer content, and share daily career + marketing insights across socials. Let’s make marketing more human (and a lot more fun).