Posting content is just one part of social media marketing. Social media managers must also listen to what their audiences say, get actively involved, and respond to feedback — that's what makes brands stand out and worth connecting with. Still, managing comments is...
Redesign For multi-location brands
all your locations, one content flow
For multi-brand companies
content collaboration at scale
For agencies
impress your clients and take on more
“The team loved it from the start. Planable helps us overview the entire marketing efforts.“
Social media engagement rate measures how actively your audience interacts with your content, but each platform calculates it differently. Instagram uses likes/comments/followers, while TikTok includes shares, saves, and completion rates in their algorithm scoring. LinkedIn weights comments higher than likes, and Twitter/X counts retweets as a primary engagement signal.
Cross-platform reporting requires choosing consistent metrics that align with your business goals rather than platform defaults. This guide breaks down exactly how each major platform calculates engagement, which social media metrics correlate with actual business results, and how to standardize your reporting across channels.
What is social media engagement rate?
The social engagement rate reflects the share of viewers who actively respond to your content (think likes, comments, or shares), out of the total who saw it. It’s usually calculated by dividing total engagements (likes, comments, shares, saves, clicks) by either:
the number of followers (common on platforms like Instagram and Facebook), or
the number of impressions or reach (used by platforms like LinkedIn, X, or TikTok),
and then multiplying by 100.
Both methods are valid, but it just depends on your platform and goal, and how you define social media success.
Why is social media engagement rate important?
Reach means nothing if no one reacts. The engagement rate is the closest thing social media has to proof of life. And here’s why it matters from a marketing standpoint:
1. It measures true audience connection
A high follower count means nothing if no one’s paying attention. Social media engagement rate cuts through vanity metrics to show whether your audience interacts with your posts or your influencer marketing campaigns, or skips them.
2. It helps evaluate content performance
Tracking engagement rate over time helps you pinpoint what works, gauge success on socials, and answer questions like:
Are carousels outperforming videos?
Do your hot takes get shared more than your how-tos?
Does audience interaction spike when your CEO posts unfiltered thoughts vs. your brand account?
A high engagement rate helps you figure out what content types, formats, hooks, and topics resonate best with the right audience.
3. It informs platform algorithm success
Every major platform, from Instagram to LinkedIn, feeds the algorithm with engagement signals. Saves, comments, or dwell time can boost your post’s ranking. The better your engagement rate, the more likely your content is to show up in feeds, recommendations, and Explore tabs.
In that sense, engagement is the currency of visibility. If you want organic reach, you need to speak the algorithm’s love language, and that means creating content for social media that sparks action.
4. It benchmarks your social health and content strategy
The engagement rate is part of your social media KPIs and an early warning system. A sudden drop might mean your audience is fatigued. A slow climb could validate a new strategy. But numbers alone aren’t the story, so context matters a lot. For example:
Is your 1.5% average good for SaaS?
Is 8% below par for a micro-influencer?
Firstly, you need to set the engagement rate benchmarks you’re monitoring, then calculate and assess high vs. low engagement. This leads us to…👇
How to calculate engagement rate in social media?
In this section, we’ll break down the main ways to calculate engagement rate, when to use each, and how to avoid misinterpreting your metrics.
1. Engagement rate by reach (ERR)
ERR measures how compelling your content is to the people who saw it. It’s the go-to metric when you care less about follower vanity and more about real-time impact. Think of it this way: you might have 100,000 followers, but if only 5,000 saw your post, that’s your real audience. To calculate engagement rate by reach, use this formula:
(Total engagements ÷ Reach) × 100
But, as reach varies widely across posts (hi, algorithm), your engagement rate might fluctuate a lot when using this calculation method. When used consistently, ERR provides insight into how compelling your content is to viewers.
2. Engagement rate by followers (ERF)
ERF is the most commonly quoted number in reports. But it’s quite misleading. It assumes all your followers saw the post, which we both know isn’t true. But it’s familiar, standardized, and easy to benchmark across industries, which is why brands and influencers still rely on it to assess social media analytics. Calculate it using this formula:
(Total engagements ÷ Followers) × 100
ERF works best for stable accounts where reach doesn’t fluctuate much. Plus, it’s easy to calculate and compare across accounts. But it doesn’t account for how many followers saw the content, so I wouldn’t use it to measure success on social media platforms.
3. Engagement rate by impressions (ERI)
ERI zooms in more than ERR. While reach counts unique viewers, impressions count every time your content appears, repeats included. So if someone scrolls past your post three times without blinking, that’s three impressions, zero engagement. ERI tells you how effective your content is per view. To calculate this type of engagement data, use the formula:
(Total engagements ÷ Impressions) × 100
Brands like to use it in paid campaigns or retargeting sequences where impressions matter more than follower count. The challenge? Impressions can be inflated, especially with auto-plays on. So it’s best to use ERI when you want to test creatives or assess content fatigue.
4. Engagement rate by post (ERP)
ERP considers just one post, one moment, one performance snapshot. It’s useful when you want to zoom in and ask: Did this piece of content work?
To zoom in on one piece and see its specific engagement metrics, use this formula:
(Total engagements on a post ÷ Total followers) × 100
This engagement rate calculation is relevant for A/B testing, campaign launches, or evaluating a carousel versus a Reel. It’s also handy for reporting to stakeholders who want specifics. But I’d avoid using it over time or across campaigns.
5. Daily engagement rate (DER)
DER measures audience interaction velocity over a defined 24-hour period, which is useful for comparing day-to-day performance when your publishing frequency is consistent or during time-sensitive campaigns. To find it, use this engagement rate formula:
(Total engagements in a day ÷ Total followers) × 100
DER can also surface time-based patterns, like: Do Fridays flop? Are Tuesdays better instead? That said, don’t obsess over daily dips. Instead, use DER to see where most engagement surfaces from or how organic engagement performs during a week-long campaign.
What is a good social media engagement rate?
A “good” engagement rate depends on platform norms, audience size, and content type. Still, knowing what’s typical helps you benchmark your performance and avoid obsessing over vanity metrics. So let’s break it down.
1. Average engagement rates by platform (Instagram, TikTok, LinkedIn, Facebook & X)
Currently, engagement rates are more uneven than ever. What’s “good” depends on the platform and your goals. But industry engagement rate benchmarks are a great starting point, helping align your content strategy to realistic standards.
So, I’ve done some digging to help you with those digital marketing reporting efforts. Recent research by Socialinsider’s indicates that:
TikTok continues to outperform with an average engagement rate of 2.5%. The short-form dominated platform is the standout channel for organic connection.
Instagram trails behind at 0.45%, down from 0.7% in 2024 (a 30% year-over-year drop). My advice is to lean into Instagram Stories, carousels, and conversation-starting captions more.
Facebook and X are tied at a flat 0.15%, which proves that these platforms now require more than organic content to drive engagement.
LinkedIn’s average engagement rate by impressions stands at 5.00%. LinkedIn’s format favors deeper content and professional insight, especially from native documents, multi-image posts, and carousels.
2. Factors that influence engagement rates
Engagement rate isn’t one-size-fits-all. It varies depending on who you are, what you post, and where you post it. For example, based on Socialinsider’s 2025 benchmarks, here’s what to watch:
Industry & niche
B2B vs. B2C, tech vs. lifestyle – context matters. For example, LinkedIn’s average engagement rate by impressions sits at 5.00%. That’s significantly higher than Instagram’s 0.45%, due to its professional, discussion-oriented audience.
Account size
Smaller accounts can grow faster. LinkedIn pages with 1–5K followers saw a 40.75% YoY growth, while larger pages (100K–1M) grew at 21.6%. Why? Smaller pages often get better engagement as they’re perceived as more authentic.
Content type
TikTok posts average 3,092 likes and 66 comments per post, while Instagram lags at 395 likes and 24 comments. Essentially, the chosen content format matters in relation to user behavior.
Posting frequency
Brands post 5x/week on Instagram and 2x/week on TikTok. Volume is just one variable. On LinkedIn, brands favor image and link posts, but engagement is driven by multi-image formats posted less than once a month.
Audience demographics
Engagement rates shift with platform norms. TikTok and Instagram drive reactions through lo-fi video and entertainment. LinkedIn leans into informative posts (multi-image, carousels, and native docs), which generate engagement rates of 6.6%, 6.1%, and 5.85%, respectively.
3. How engagement rate benchmarks vary by content format
Some content formats work better than others. Here’s how they compare:
TikTok videos
Lead all platforms with 2.50% average engagement. They also drive the most likes (3,092), comments (66), and shares (170) per post.
Instagram Reels, Carousels & Stories
Perform better than single-image posts. Though overall engagement is lower (0.45%), carousels and interactive Stories are top performers.
LinkedIn multi-image & native documents
Multi-image posts have the highest engagement (6.6%) and most likes (285 on large accounts). Native documents follow at 6.1%, showing the value of scrollable, educational content.
Facebook & X
Both platforms see flat engagement at 0.15%. Even here, interactive content like live streams, polls, or Q&A threads offers better odds than static posts. I’d suggest that Facebook groups are a hot spot to share interactive content like polls and reach new followers.
Polls
Especially on LinkedIn, they generate the highest impressions. A strategic poll with a hot take or strong POV works wonders if you want to reach new audiences.
If you’re brainstorming social media post ideas, let performance guide format. Do so through A//B testing, especially until you find what works for your audience and generates consistent, strong engagement.
6 tips to improve your engagement rate measures
Engagement is a direct reflection of whether your audience cares about your content. Here’s how to fix it strategically:
1. Create audience-focused content
If you want valuable insights to guide your engagement strategy, start with a social media audit. Review the content that’s been saved, shared, commented on, and clicked. Check the numbers side by side. This will help you notice what content types deliver the best engagement rates.
Pay attention to formats, too:
Is your carousel getting a lot of saves, but your short-form video getting skipped?
Are people engaging in the comments, or just scrolling past?
Layer that with what you know from customer feedback, support conversations, Reddit threads, Discord groups, or internal community managers. What questions keep coming up? What content does your audience interact with most? Are they reacting in DMs too?
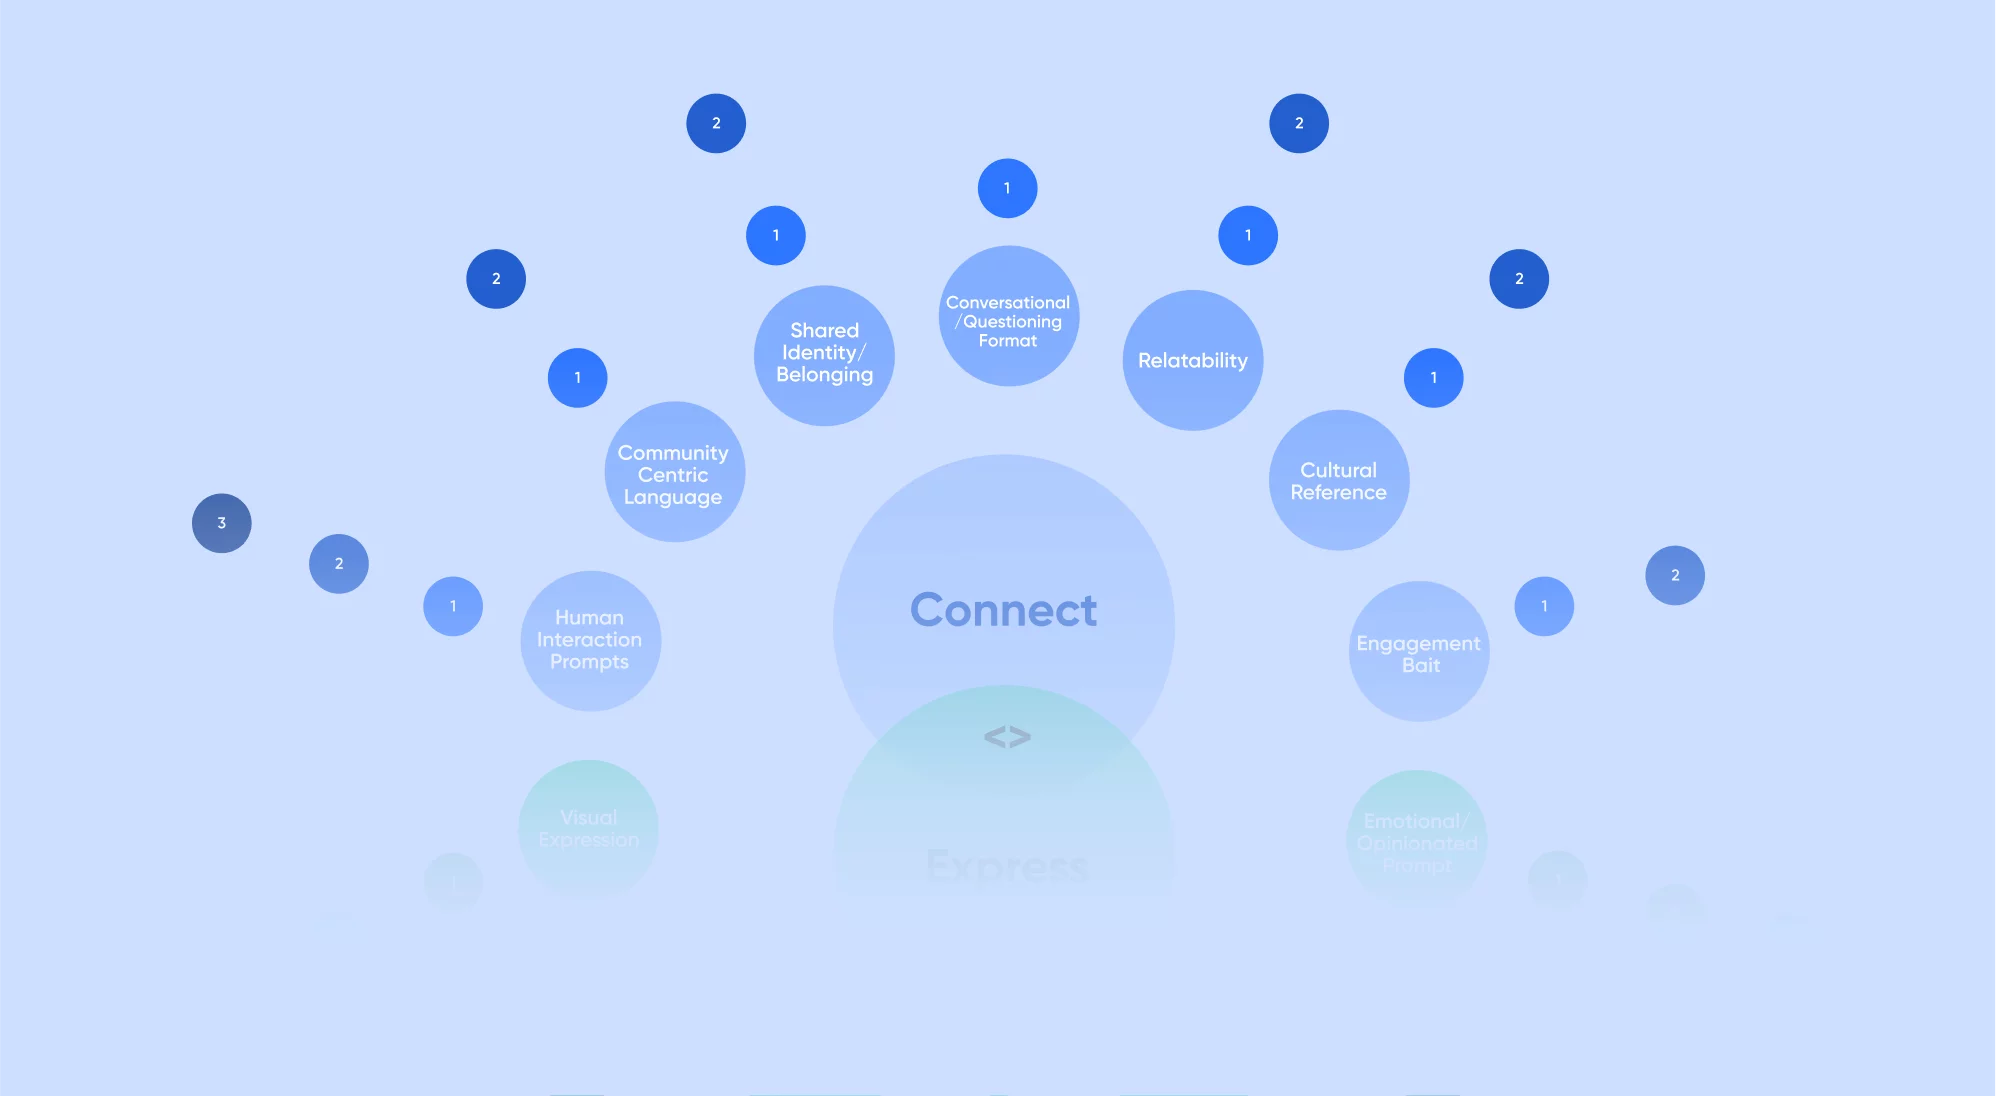
Here’s what the data tells us: posts with strong engagement rates consistently tap into one of two emotional patterns. People either want to feel part of something bigger (community, shared moments, “we’re all in this”) or they want to signal who they are (identity, values, “this is so me”). When your content activates these instincts, people don’t just like: they save, comment, share, and tag.
That’s the difference between passive scrolling and active participation.
Our Connect Express framework maps exactly how these patterns show up across platforms, based on 3,600+ analyzed posts, so you can design content that hits these triggers intentionally.
Get the free Connect <> Express framework
Once you have that, build your content pillars around it, even if it’s not what competitors are doing. As top-of-funnel content floods the internet and more creators rely on AI to churn out sameness, what sets your brand apart is how people generate engagement with what you post, not how much of it you publish.
2. Optimize posting times and frequency
The best time to post depends on your audience’s habits, so start by reviewing when people are online and engaging with your content.
Then, test. Try posting earlier or later in the day. Vary weekday vs. weekend posts. Watch what happens when you post twice a week vs. 5 times. You’re looking for the sum of all returns, not just peak likes. This includes deep audience engagement like saves, comments, and reposts.
Equally important is finding your frequency. Most brands settle around 5 posts per week on Instagram and 2 on TikTok, according to Socialinsider. On LinkedIn, the majority of brands post images ~5x a month, links ~4x, and sprinkle in videos, polls, or multi-image posts once or twice monthly.
The most important thing is to build a cadence that your audience and your team can sustain.
3. Craft engagement-worthy captions
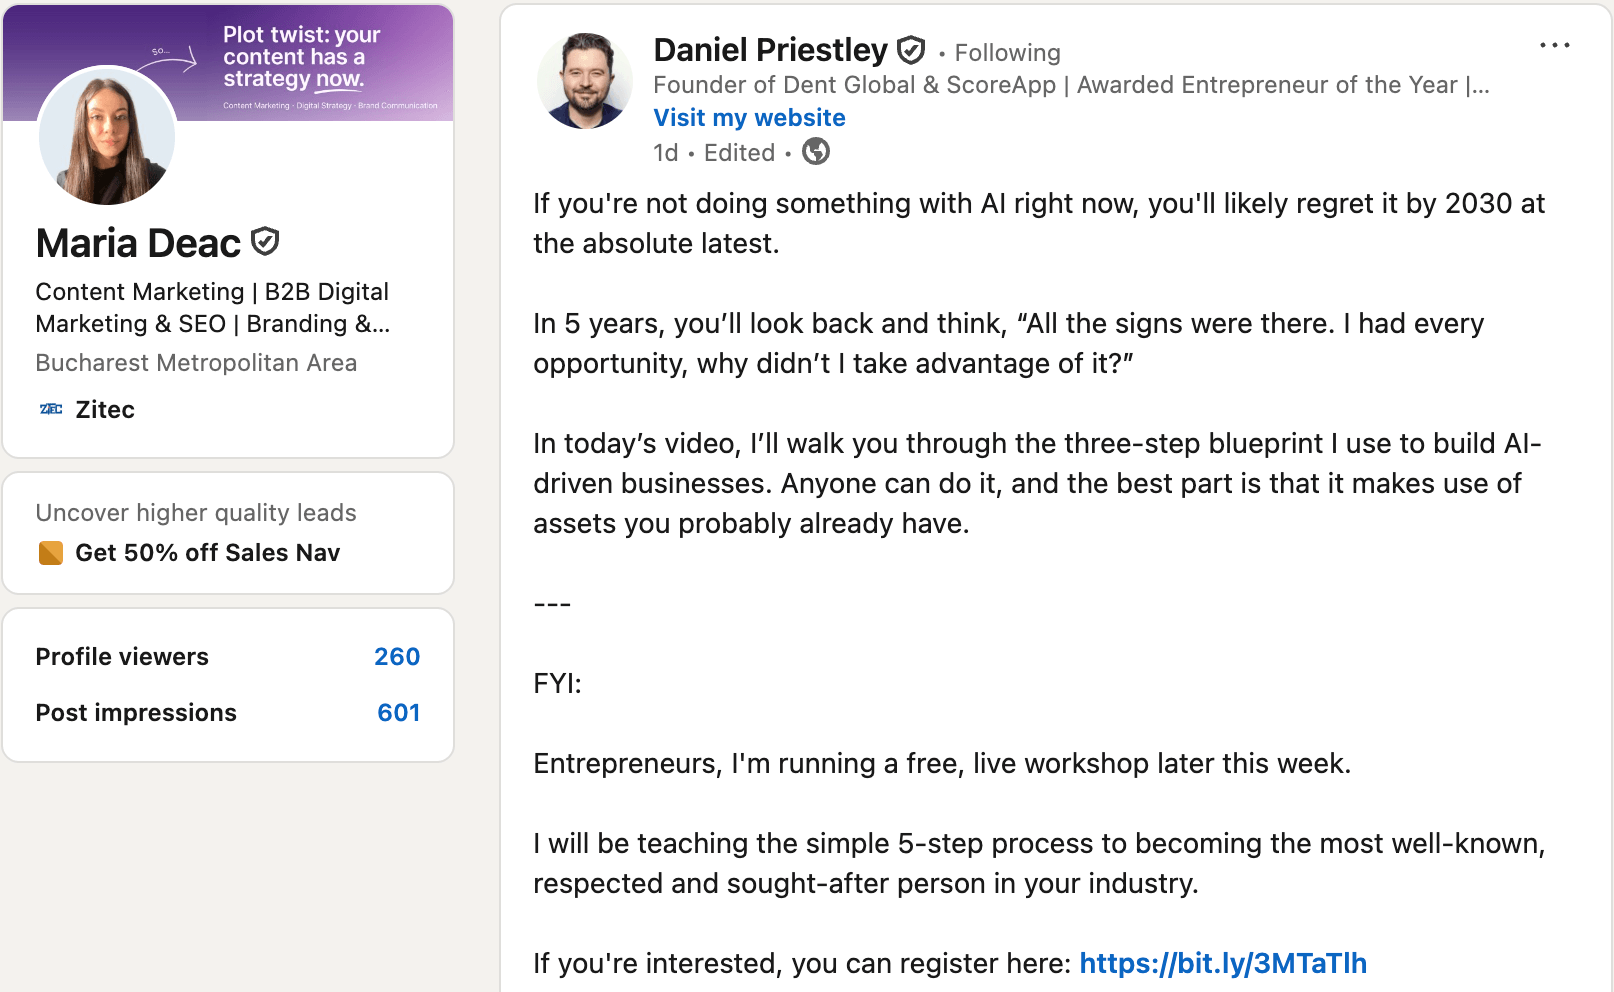
Daniel Priestley’s LinkedIn post discusses AI strategies, with visible engagement and user metrics.
Captions pull people in and open conversations. Write them using storytelling techniques like AIDA, problem-solution-benefit, problem-agitation-solution, and more.
Keep in mind that the first line (or the hook) matters most. To craft a great hook, Daniel Priestley’s 5 hook types are a great shortcut:
Scary: Triggers fear or urgency. Example: “This one scheduling error got our account shadowbanned.”
FreeValue: Offers something of value, benefit-driven for the end user. Example: “Steal our social media audit template – no email required.”
Strange: Feels unexpected or counterintuitive. Example: “We grew our engagement by posting less.”
Sexy: Usually not applicable in most industries. Translated to universal engagement tactics, it means highlighting status, desirability, or aspirational outcomes. Example: “The exact caption formula brands like Glossier and Duolingo are using right now.”
Familiar: Taps into something widely recognized or universally understood. Example: “You know that moment when you hit ‘publish’ and immediately spot a typo?”
Then, layer in your story, and finish with a CTA. Ask a real question, invite opinions, or ask people to click on your link. If writing fresh captions feels like a chore, Planable’s AI caption generator can help you find the right tone, hook, and format tailored to each platform.
4. Respond consistently to comments
Timely, human replies show your audience that there’s someone behind the account who’s listening. Plus, engagement data shows that they can spark conversation and maintain a positive community dialogue (especially when we’re talking about social media moderation).
That interaction loop of comment, reply, reply back, is where relationships deepen and algorithms take notice of your high engagement rate.
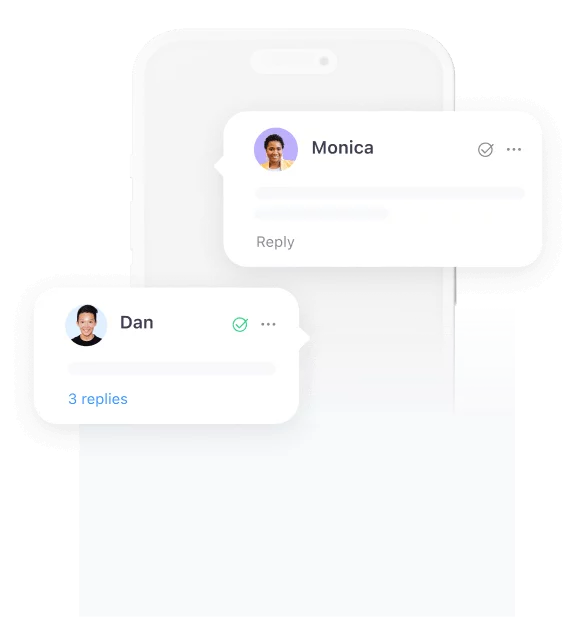
Spot and manage social media comments across all connected platforms: so no message falls through the cracks.
With the unified inbox, you can reply, react, organize by status, or delete when needed.
Also, you can group comments by sentiment: positive, questions, negative and let AI reply when your brain checks out.
5. Use interactive features to boost engagement metrics
Interactive elements help boost your social media engagement rate and audience participation across formats:
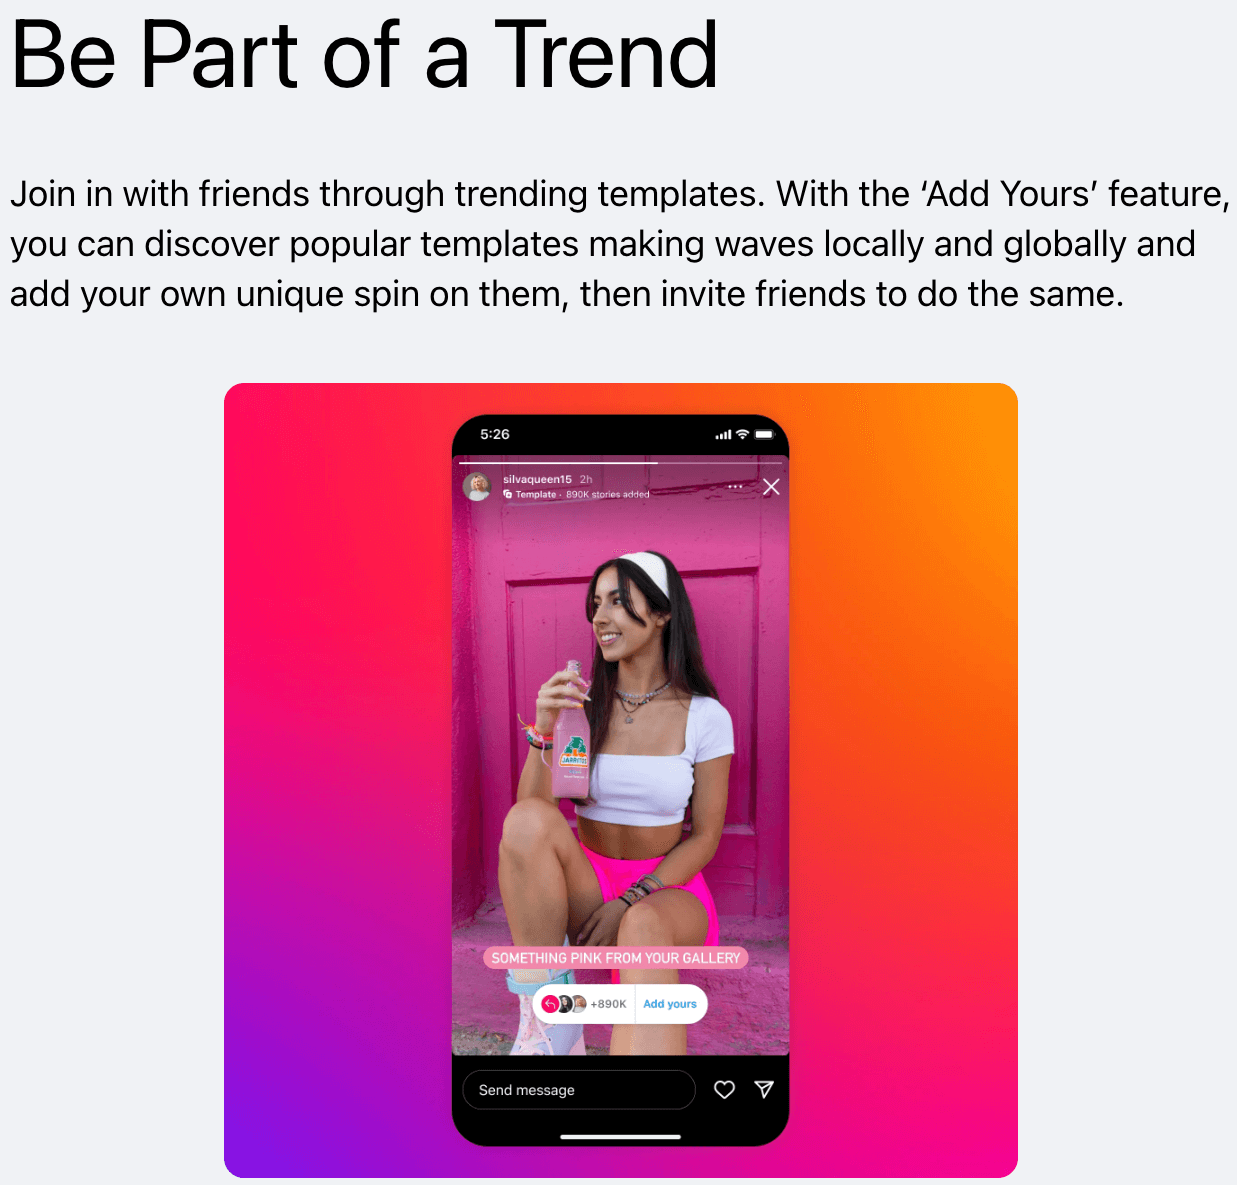
Instagram & Facebook: Stories are your go-to. With these Meta formats, you can use question stickers, poll stickers, quiz stickers, mention stickers, countdown stickers, emoji sliders, or join a trend with the “Add yours” feature.
Instagram encourages users to join trends via Story templates, boosting interaction with followers.
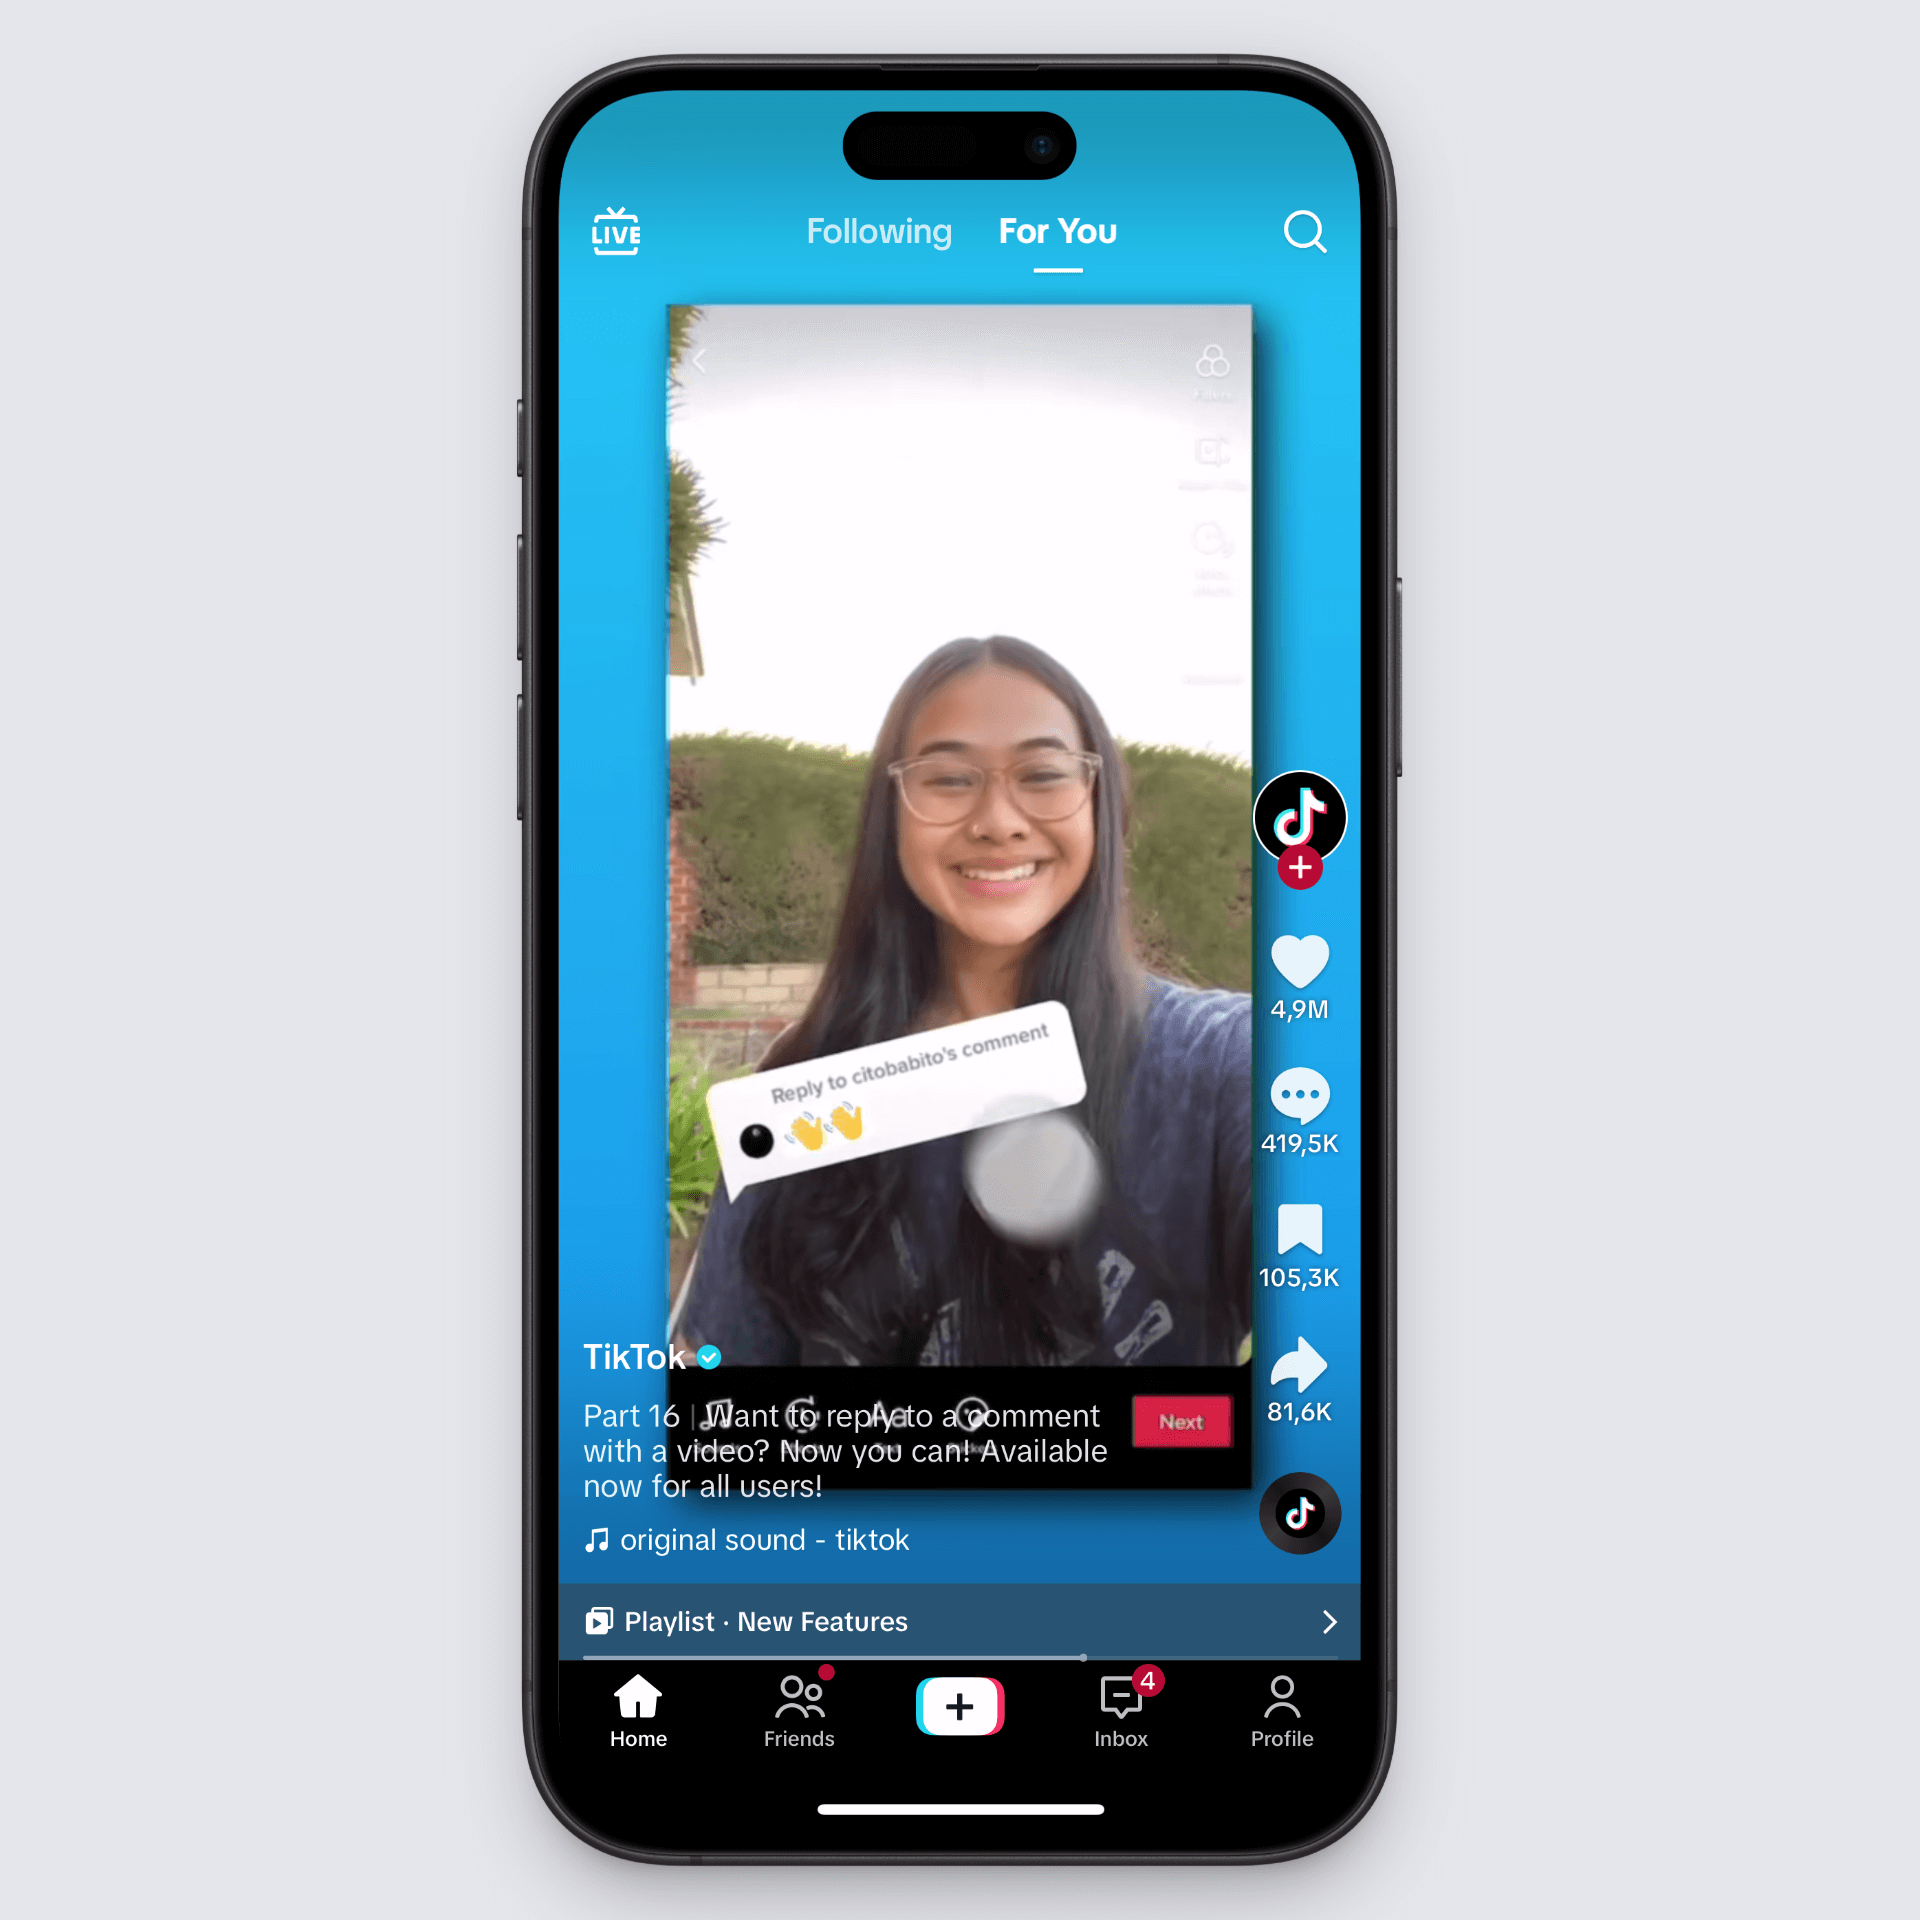
TikTok: try comment-based prompts (“What would you do in this situation?”), stitch/duet challenges, and the native Q&A feature for creators.
TikTok highlights its feature allowing creators to reply to comments with a new video.
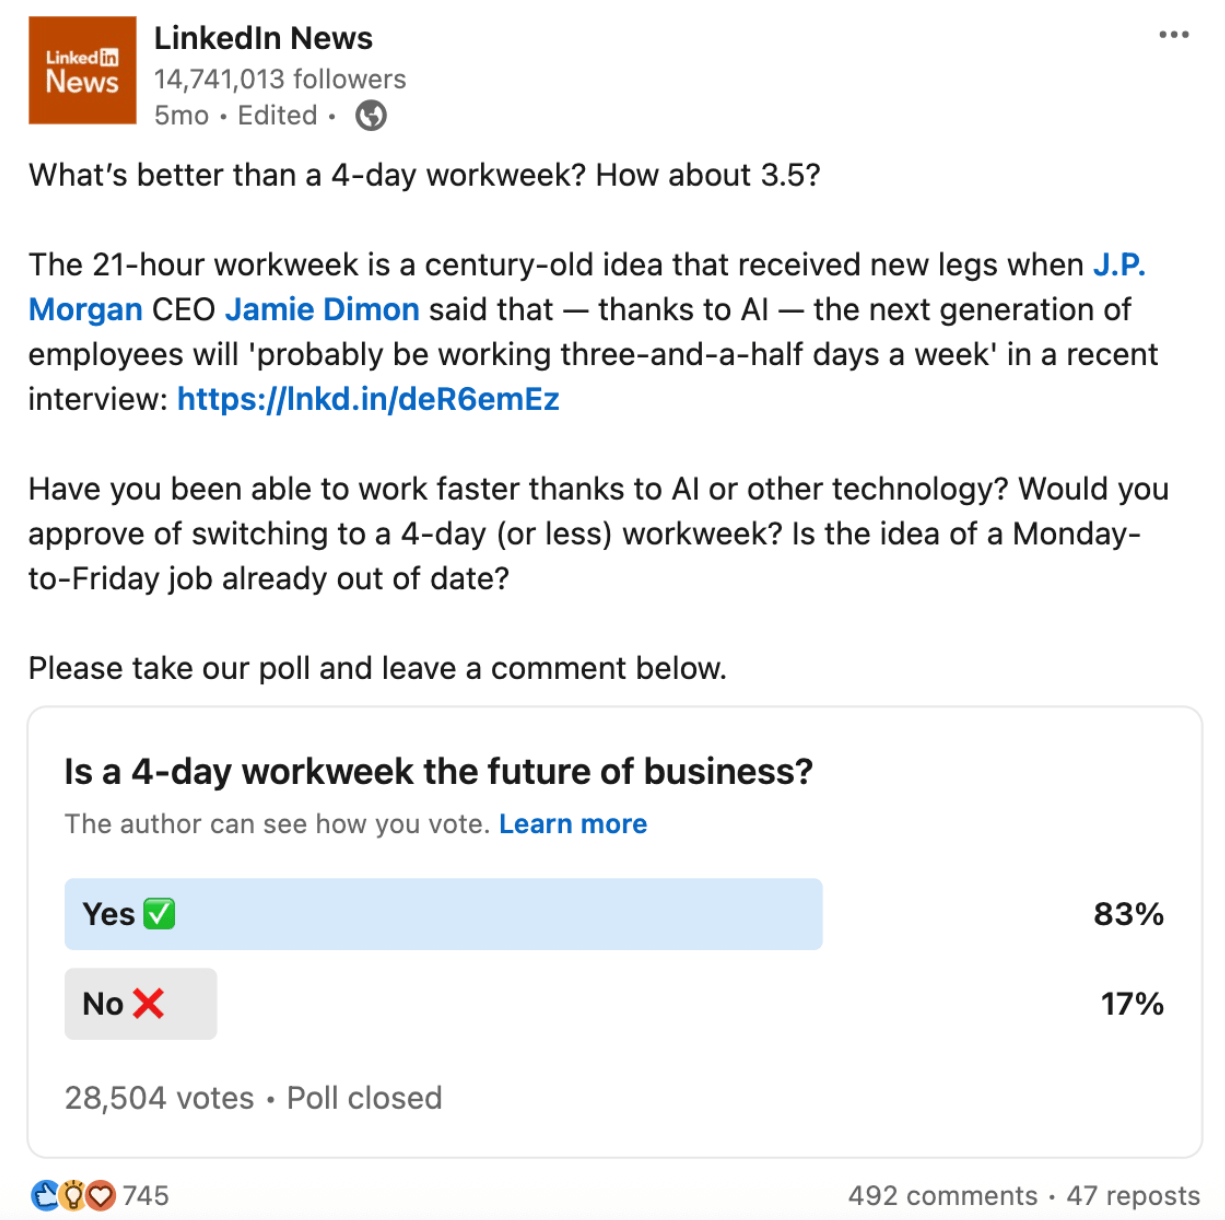
LinkedIn: Use polls for B2B research or opinion-gathering (e.g., “Where do you get your marketing insights from?”). Treat them as light thought-leadership pieces.
LinkedIn News shares a poll on the 4-day workweek trend, showing strong support among users.
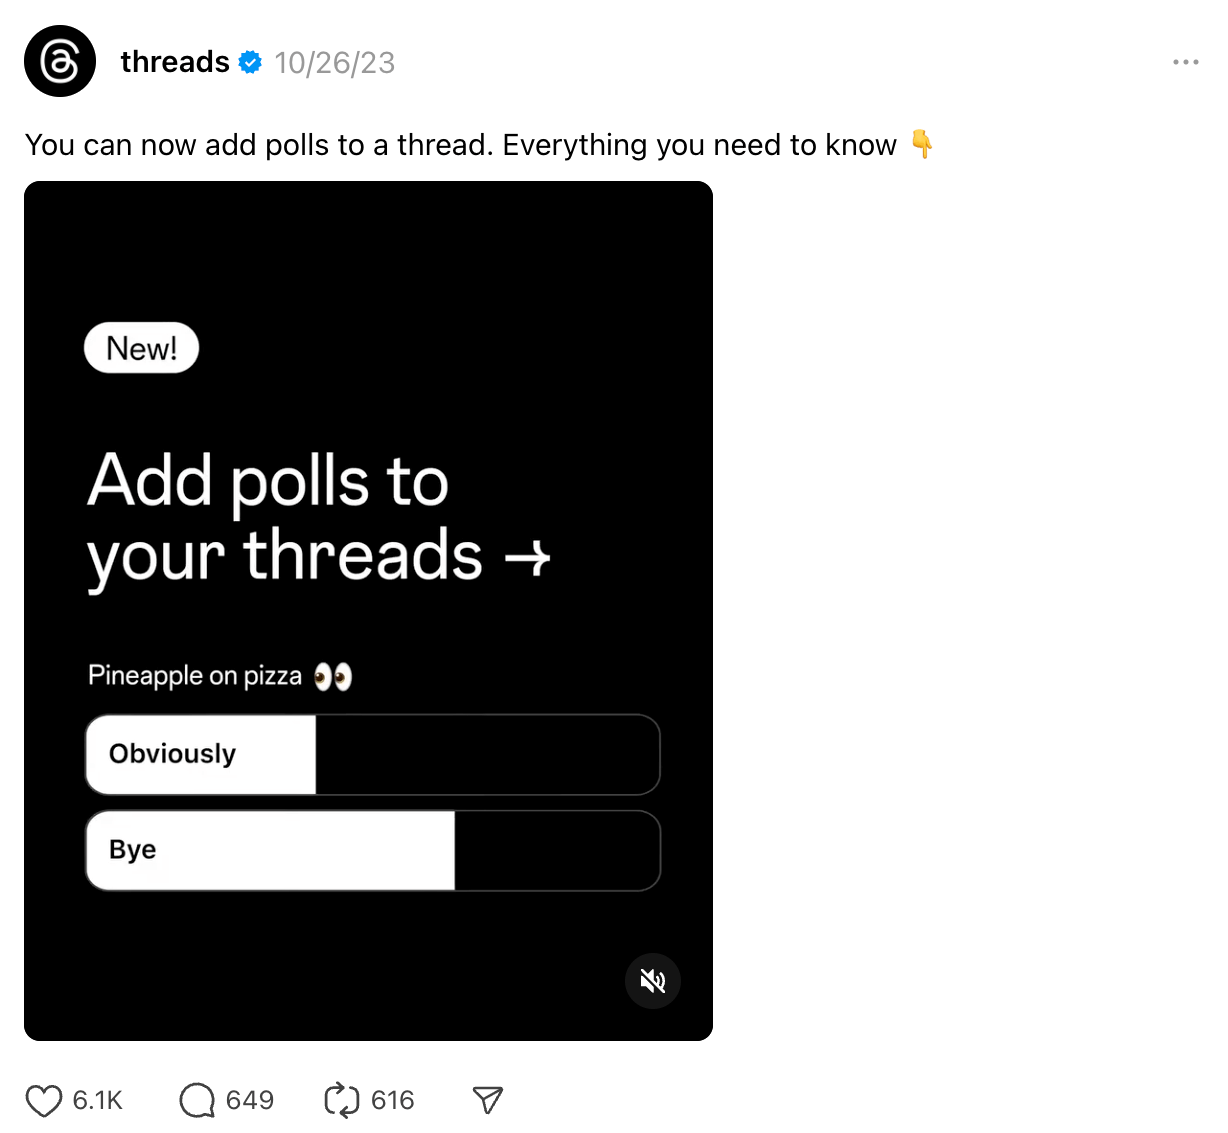
X (Twitter): Run threads with embedded polls to drive engagement and dwell time. This will help position your brand as thoughtful, not just promotional, and boost engagement with each response.
Threads introduces polls in threads with fun questions to boost user interaction and engagement.
YouTube & Shorts: Use Community tab polls to test titles or video ideas, and use pinned comments to ask for feedback or topic suggestions.
Pinterest: For Idea Pins, include poll stickers where available (in beta in some regions). For e-commerce, try prompts like “Would you wear this?” or “Save for later?”
6. Track and analyze performance
Not all engagement is the same, and both people and the algorithm know it. Impressions are cool, but comments are better. And a repost is like that little extra mile someone went because they liked your post. You’ll usually notice that brand advocates repost your content the most.
So, when measuring engagement rates on any social platform, start with these metrics:
Engagement rate by impressions – shows how your social media content performs when actually seen.
Engagement rate by followers – helps spot whether you’re activating your audience or broadcasting to inactive accounts.
Comments-to-likes ratio – can reveal depth by asking: Did the post spark a scroll or a conversation?
Then, zoom out:
Platform benchmarks: A 0.45% engagement rate on Instagram is average in 2025, but the same number on LinkedIn (where 5%+ is common) means something’s off.
Frequency vs. fatigue: Watch for drop-offs when increasing or decreasing post cadence, because your ideal rhythm may not match industry norms.
Time-based patterns: For example, are Thursdays outperforming Mondays? Use this to inform scheduling.
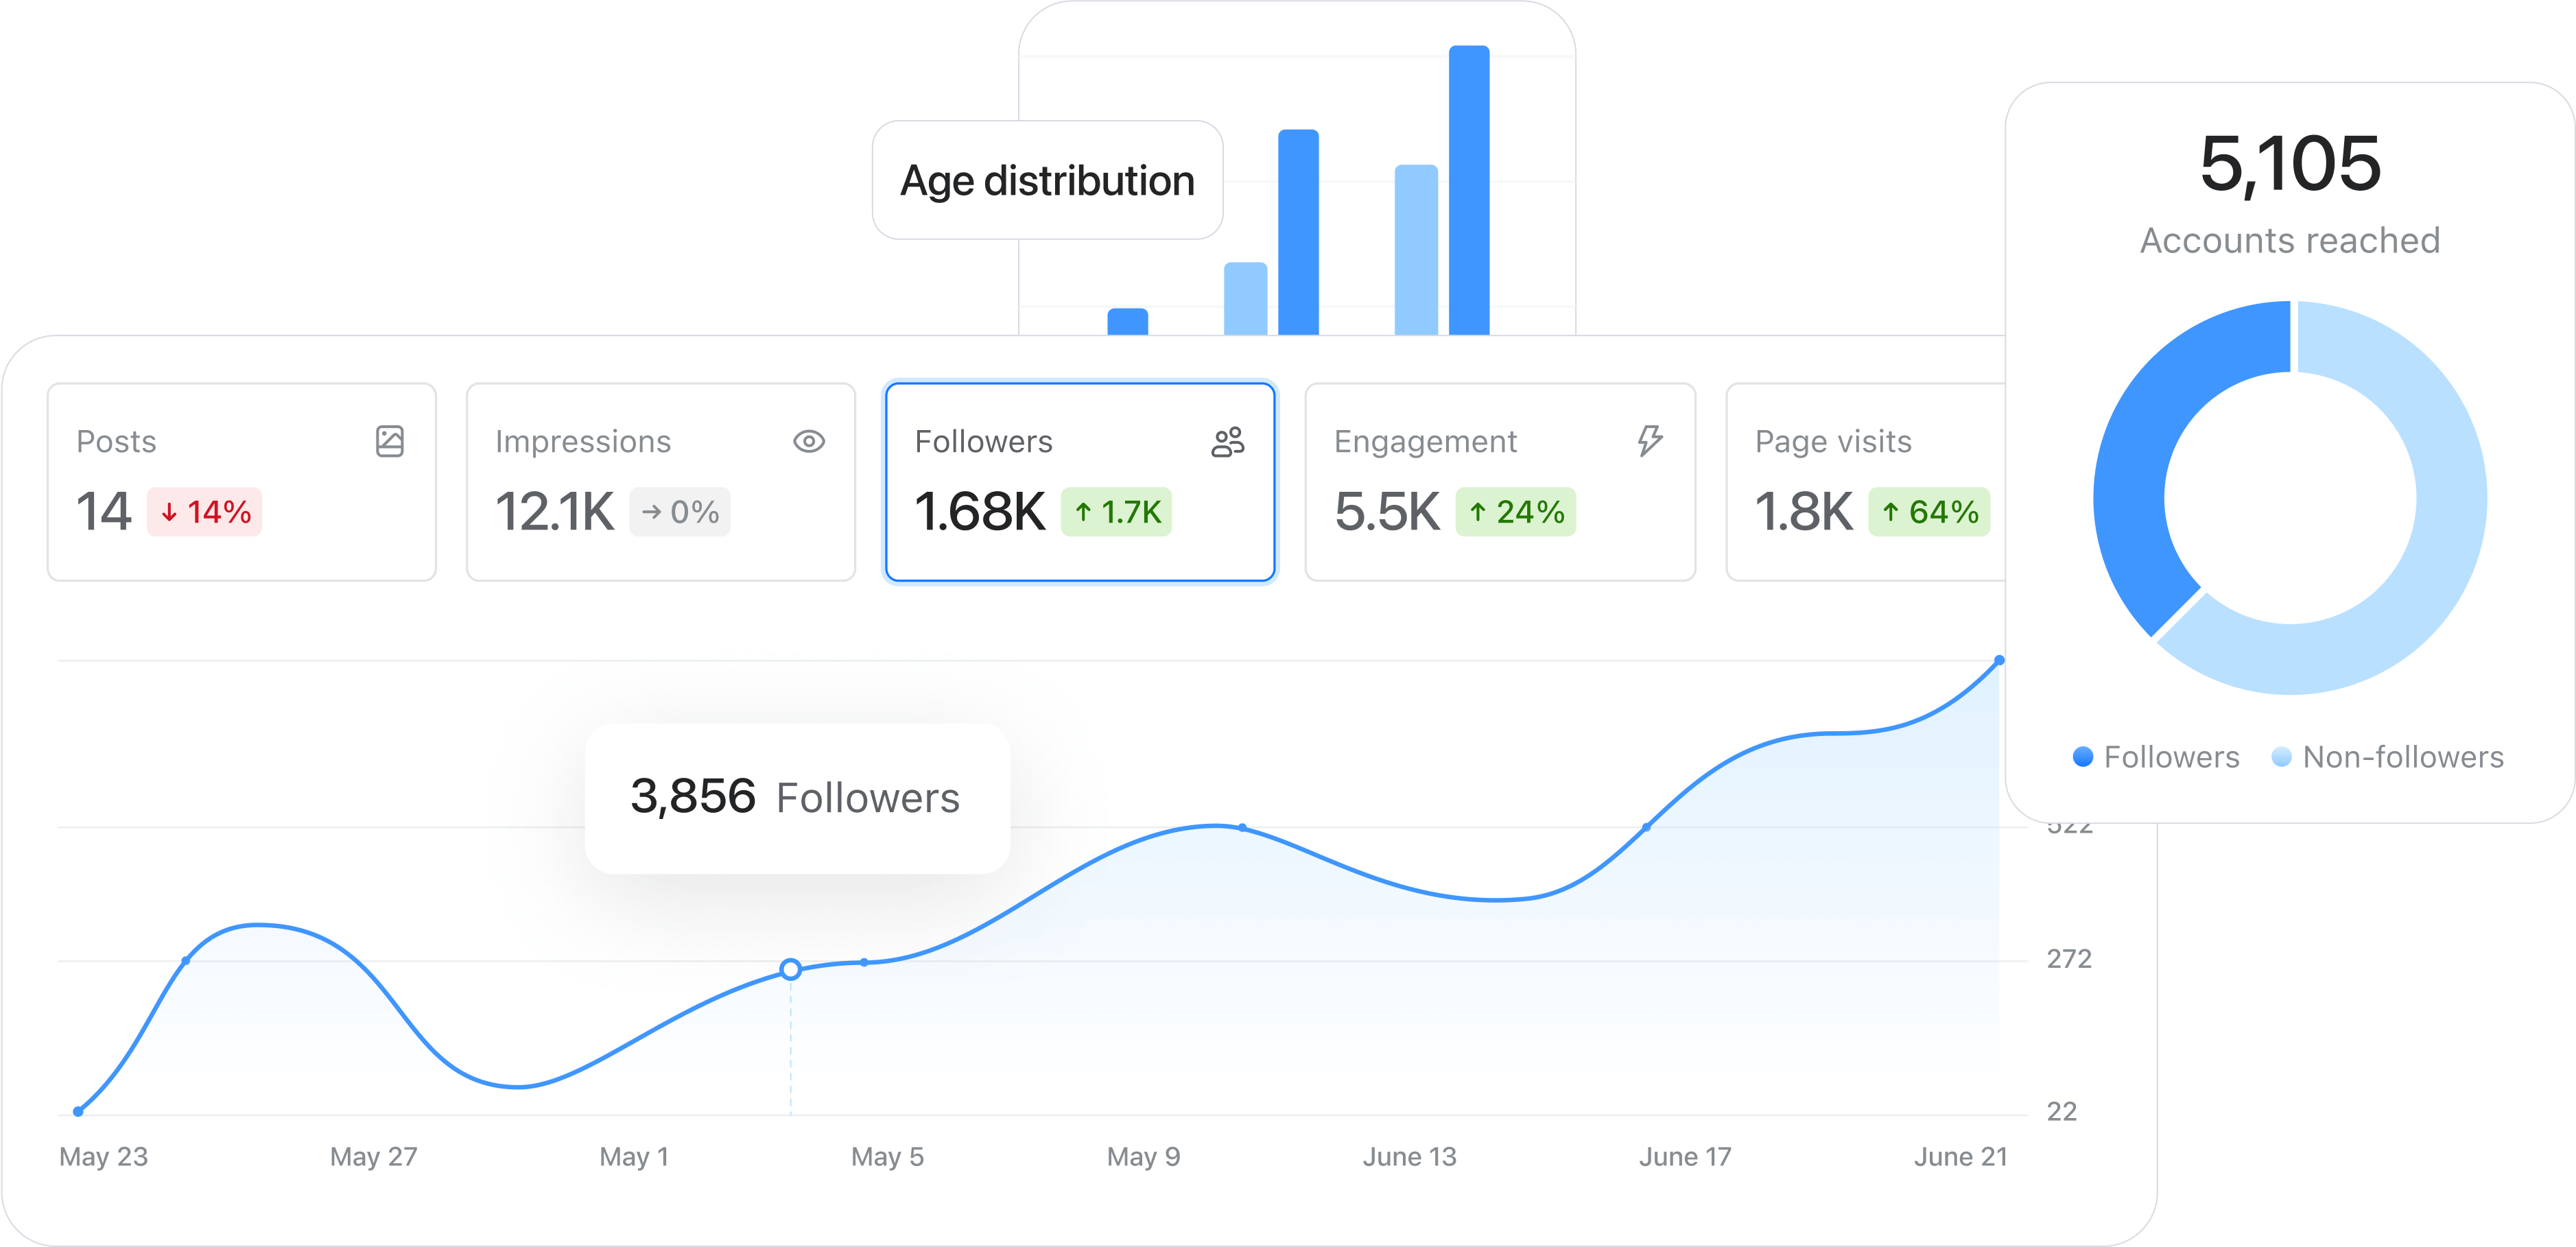
Audit social media engagement monthly. Begin by reviewing platform-level KPIs like impressions, saves, and your comments-to-likes ratio, which are indicators of reach and relevance. Then, take it a step further inside Planable, where analytics help you spot which content types and formats consistently drive engagement across platforms. This way, you can adjust your content calendar with data-backed facts.
Overview of follower growth, impressions, and engagement metrics on a Planable analytics dashboard.
How Planable helps you boost social media engagement rates
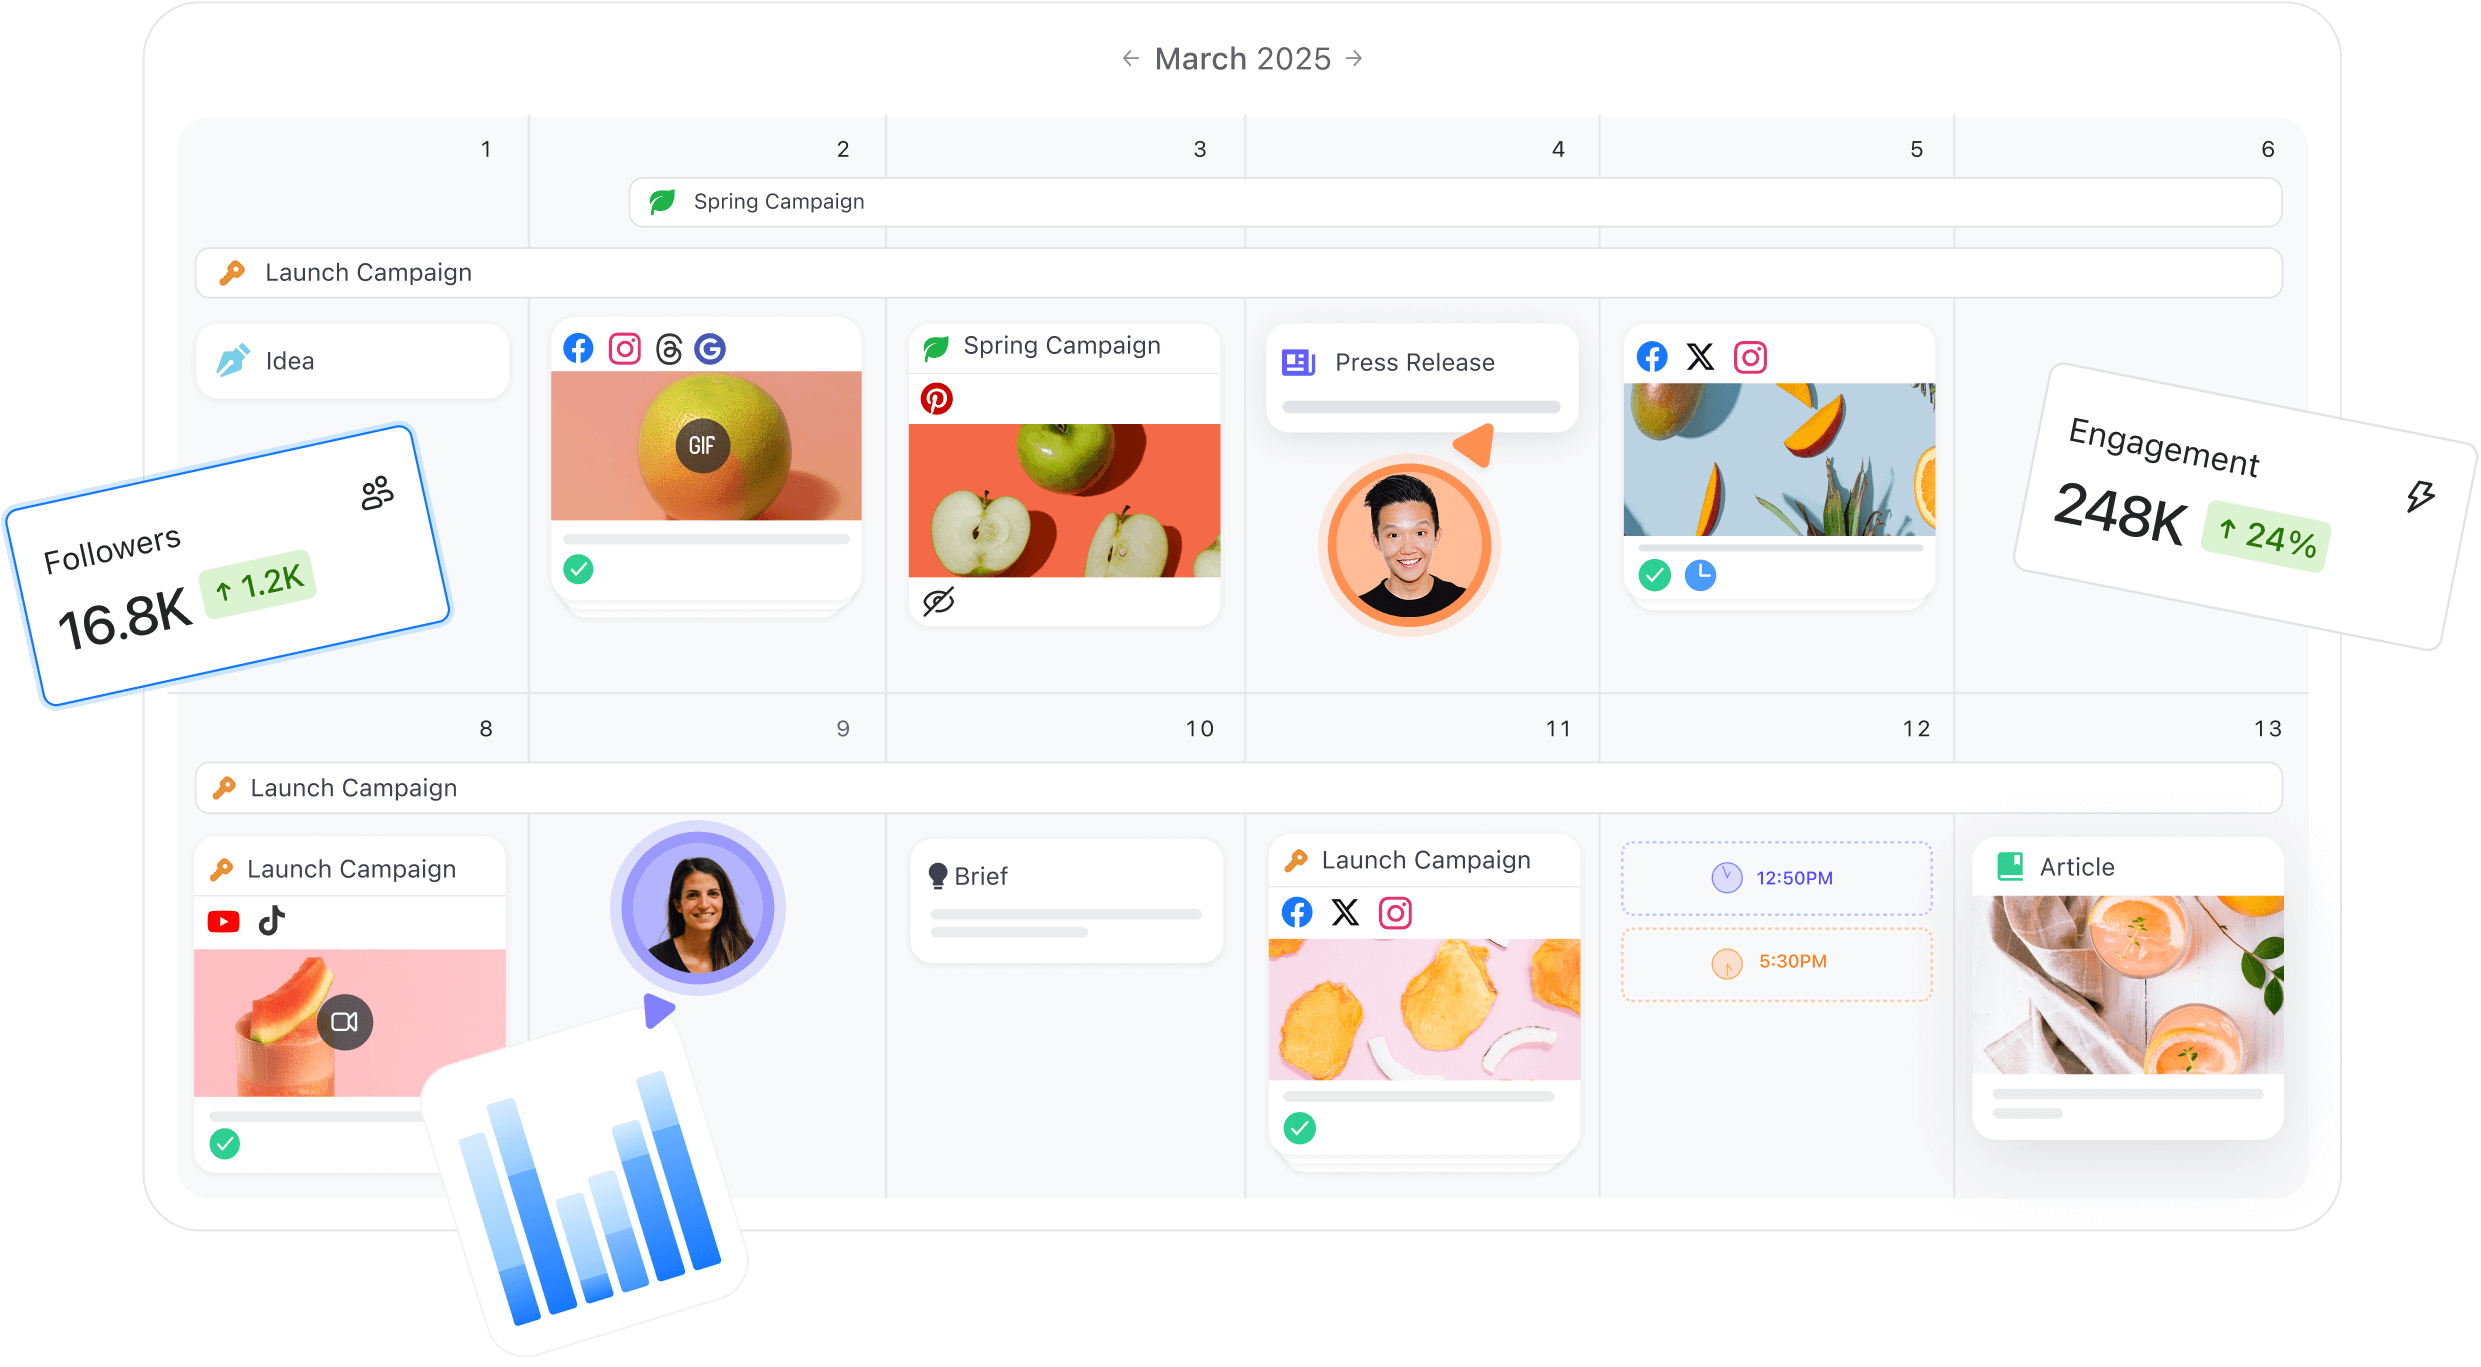
Planable helps content and social teams get on the same page. It’s where marketers draft, preview, and approve posts across all platforms in a shared visual calendar. That means fewer misfires, better consistency, and faster turnarounds.
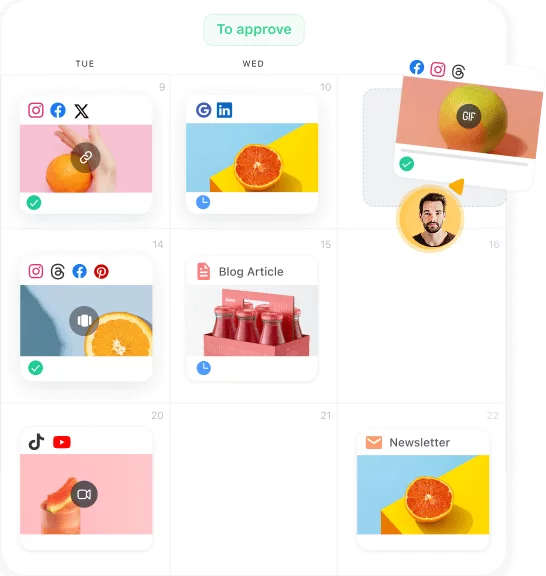
Planable’s content calendar displaying campaigns, post scheduling, and performance indicators.
Let’s say your carousel underperformed last week. Planable’s analytics let you check engagement rates by platform and post type without switching tools. If your team spots a dip, you can revisit the post, leave internal notes, and brainstorm fixes on that same post, in the same thread.
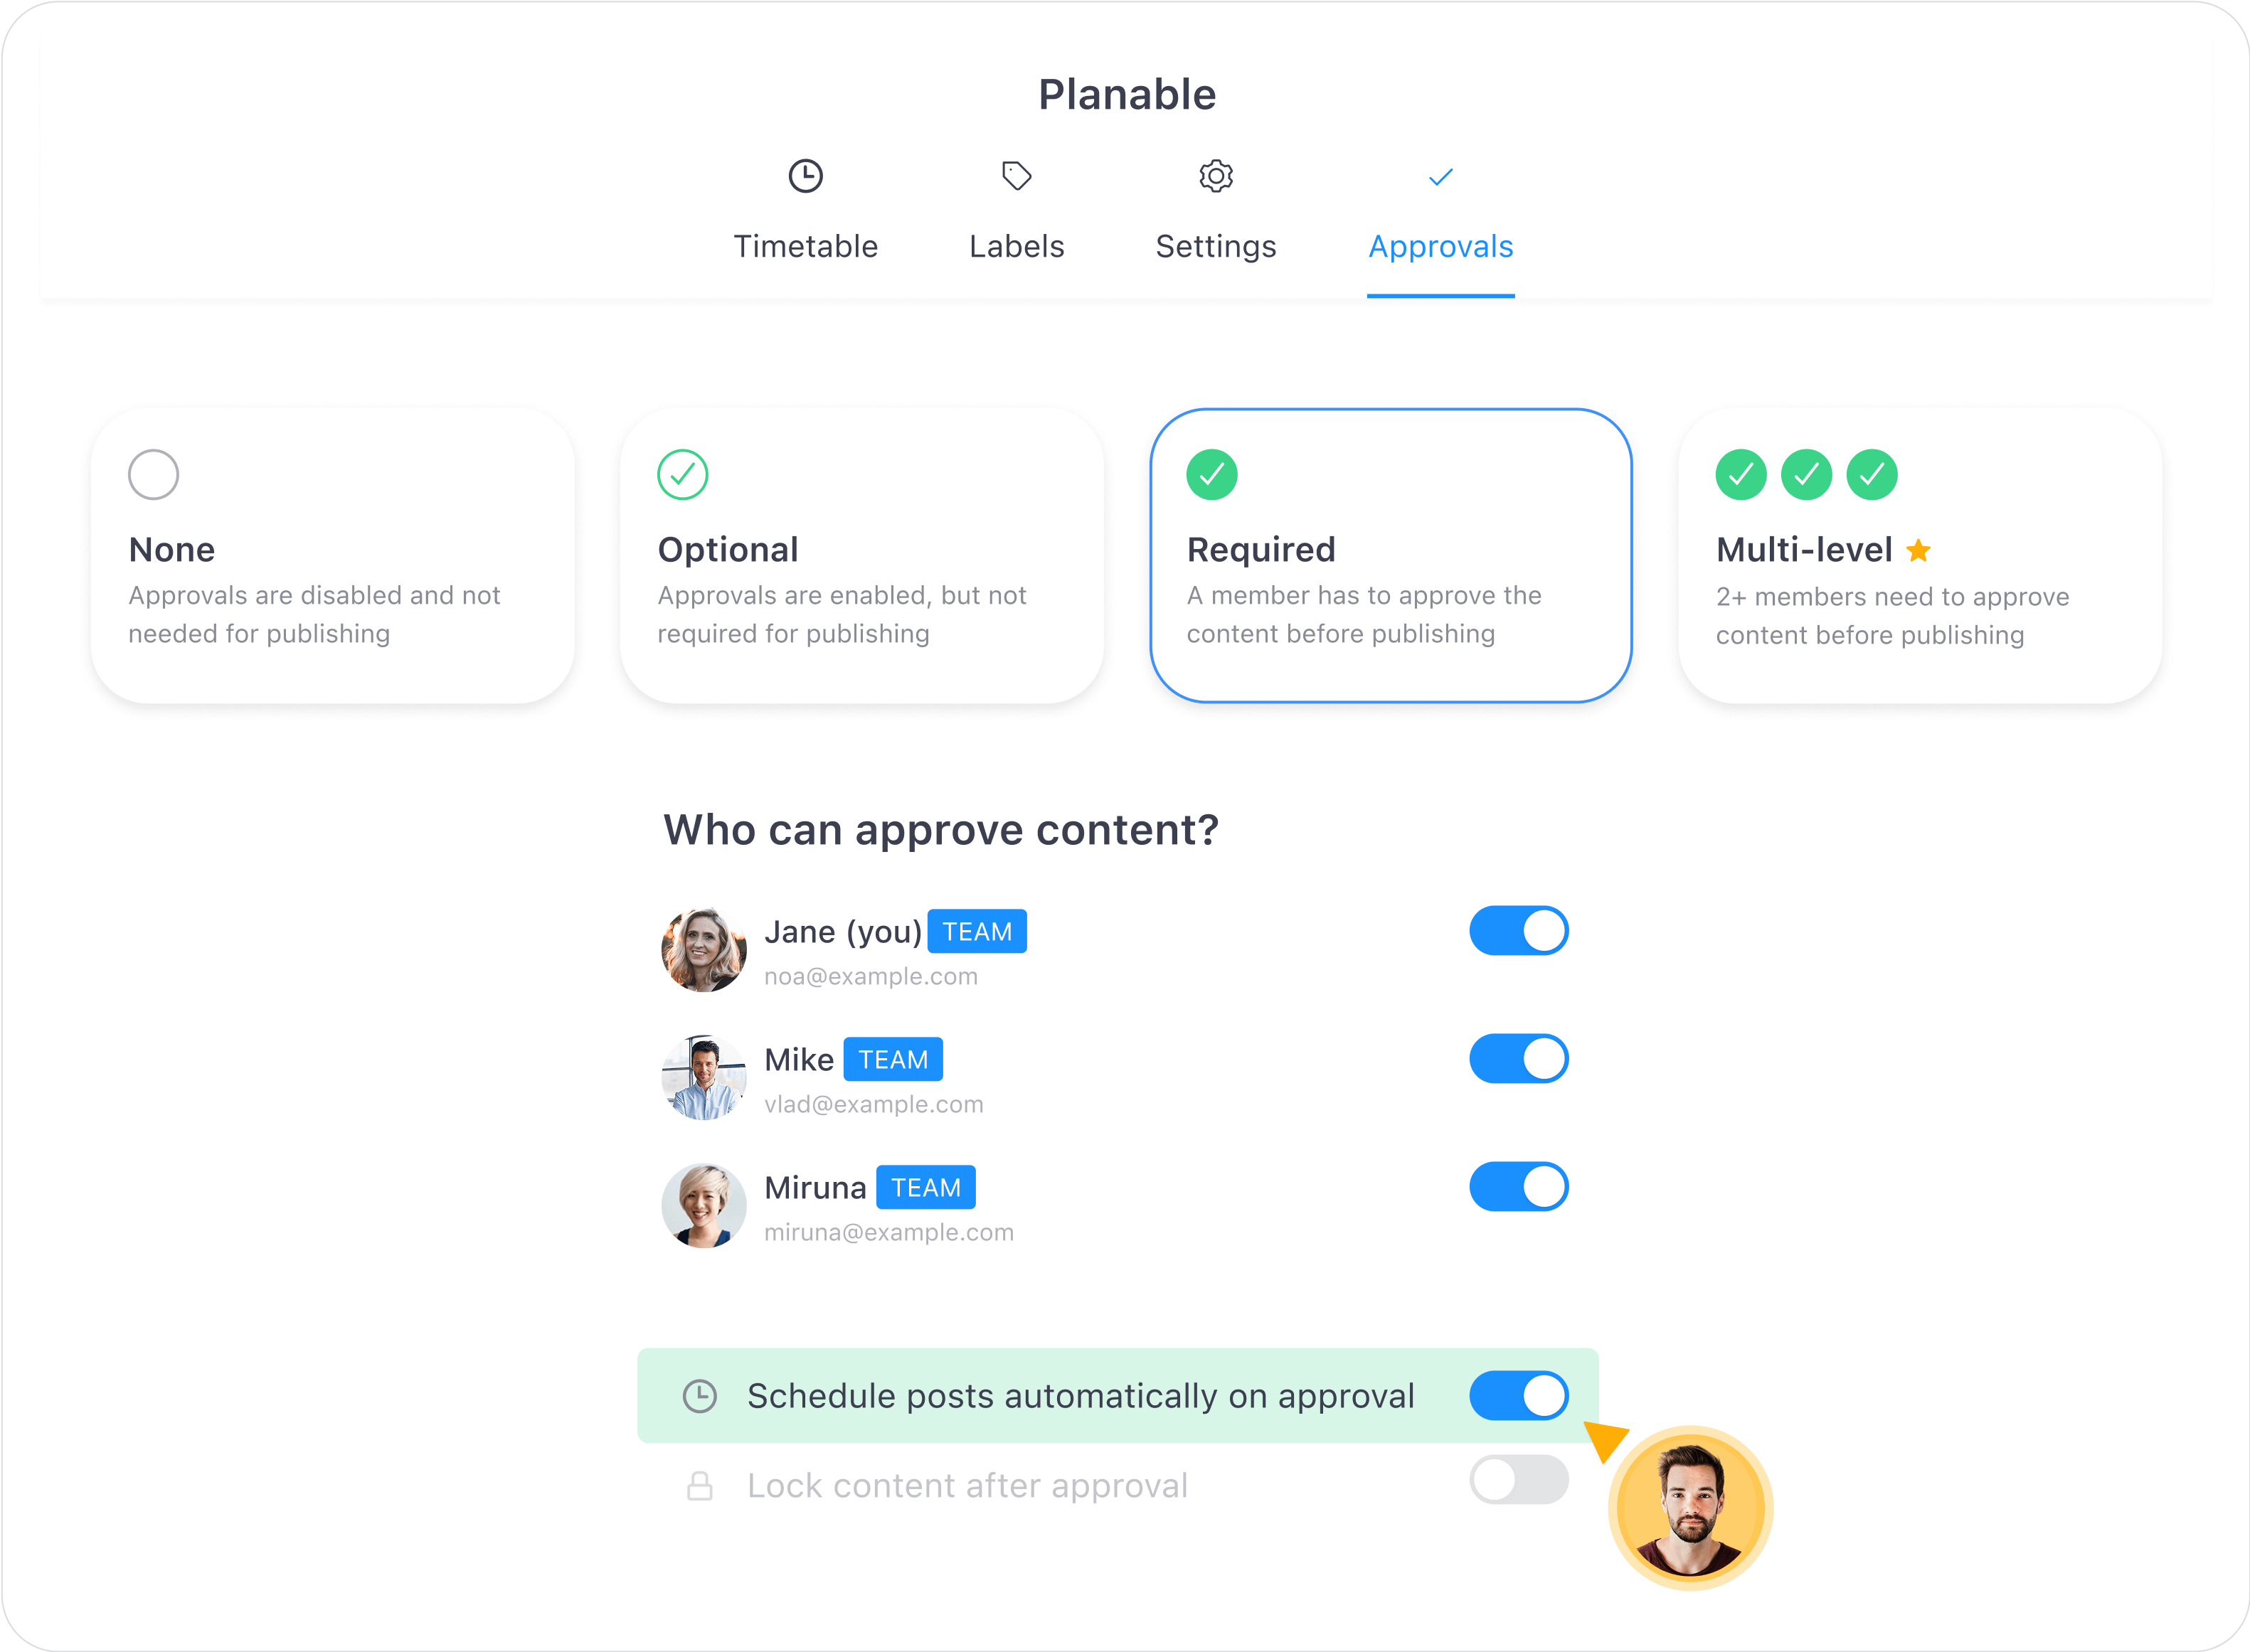
Content approval workflows in Planable are just as clear. You can reply to comments from all platforms in a unified inbox, flag messages that need escalation, and assign replies to teammates based on status. No more missed DMs or “Who’s handling this?” moments.
Planable’s multi-level content approval setup with role assignments for publishing control.
And because everything, from captions to feedback, lives in one place, high-performing posts become reusable playbooks for your team. Use vetted engaging content to craft even better posts and grow your internal engagement rate benchmarks.
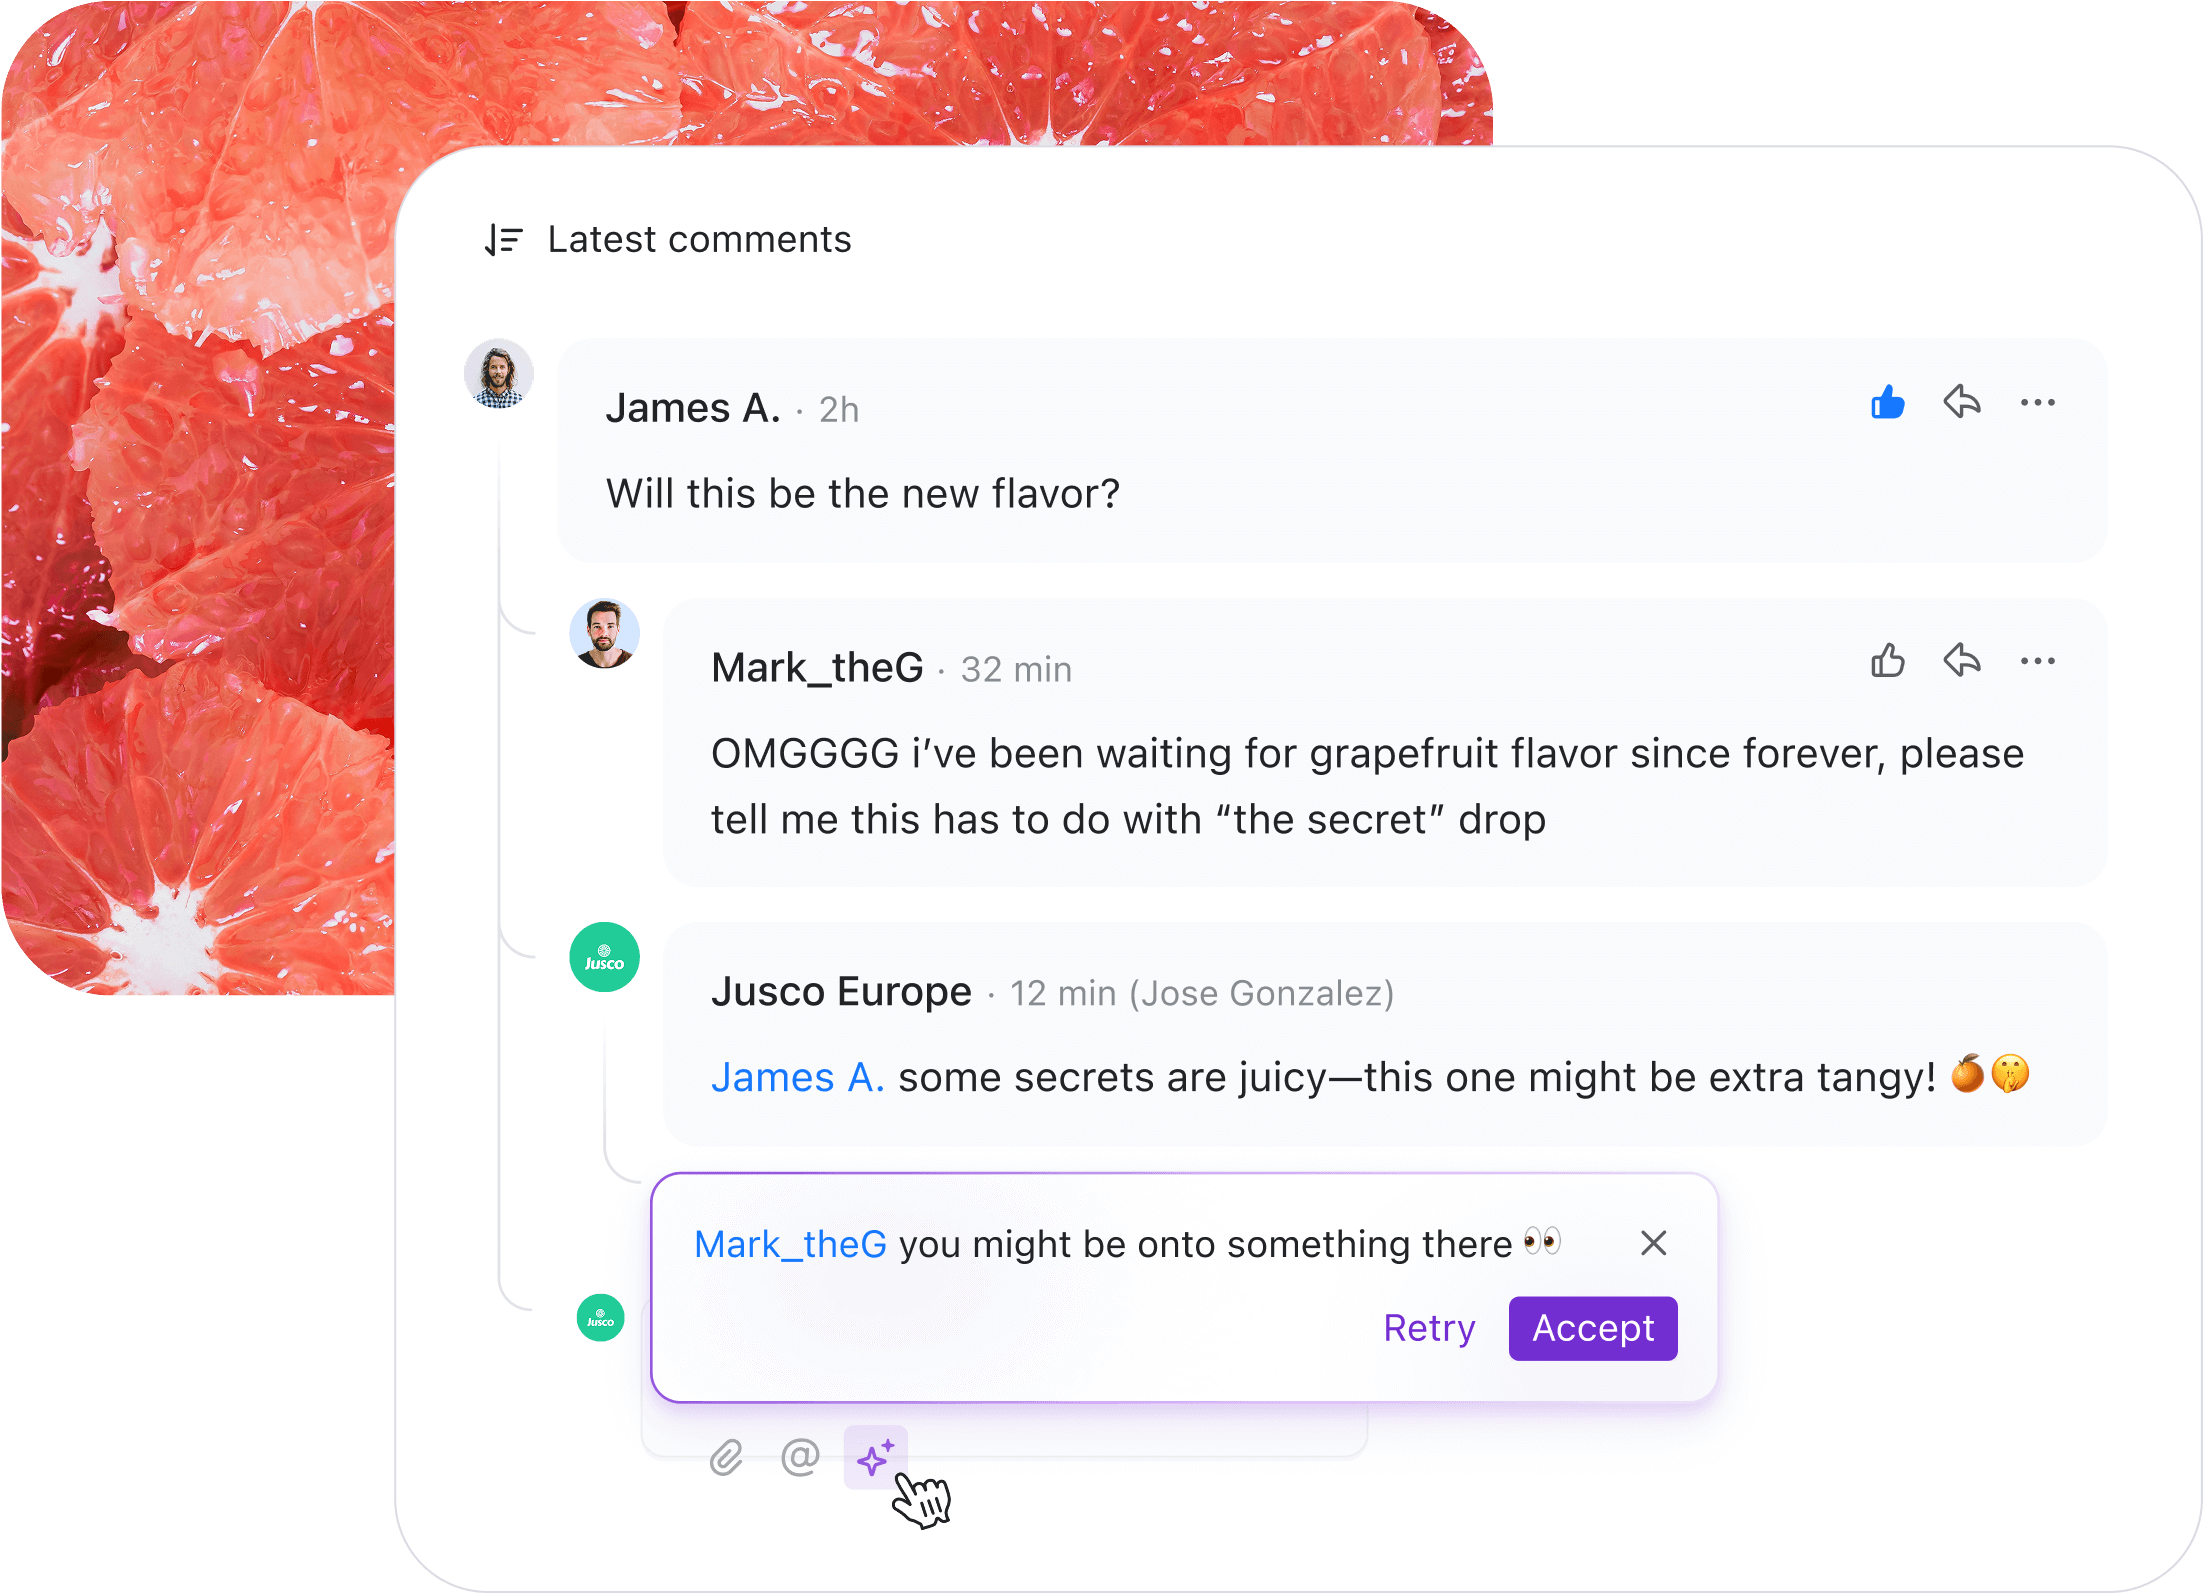
Planable’s comment feature enables teams to collaborate on social media posts with real-time feedback and replies.
Planable also helps you track performance. Its built-in engagement tracking shows how your content performs across platforms, formats, and timelines.
You’ll see engagement metrics post by post, then link that insight back to the creative and the discussion thread where it all started. That means your team can revisit a post, leave comments, test improvements, and adjust directions in real time.
Start improving your engagement rates with smarter social media management
If you want to upgrade your content and reach a high engagement rate, you need to start looking at what I like to call the 3Ps:
Posts
Process
Progress
Ask yourself: Which posts spark replies vs. passive likes? Are your CTAs ignored or acted on? Start by benchmarking your average engagement rate by platform (look for industry-specific engagement rate benchmarks), then test formats weekly. For example, you could try:
Adding poll stickers
Posting two hours earlier
Swapping static posts for carousels
Lastly, use a tool that lets you preview, tweak, and measure it all in one place. That’s how you build real traction, one informed iteration at a time.
PS: Try Planable – it gives you 50 posts for free, plus everything in one workspace, from previewing posts to replying to comments.
Maria is a content marketer, SEO copywriter, and social media specialist with experience working for a wide range of B2B businesses. She loves to keep up with the evolution of digital marketing, particularly in areas such as social media management, content, SEO, and PR. She is passionate about her work and loves to add a unique spin to any topic.